Working Papers
The Effect of Firm Subsidies on Credit Markets
PDF
› abstract
Governments use firm subsidies to spark corporate investment, which may have repercussions in credit markets though. To test for potential credit market distortions due to this economic policy, we combine project-level information for the largest regional economic development program in German history with bank lending and firm borrowing over a long horizon: 1998–2019. Firm subsidies associate with larger lending volumes provided by banks. On the flip-side of credit markets, we document increased corporate borrowing. Importantly, we find neither evidence of excessively risky lending by banks nor crowding-out of credit to nonsubsidized firms. Firm subsidies support lending especially when credit constraints are elevated during the financial crisis. Overall, firm subsidies unfolded a positive multiplier effect in regional credit markets in our setting.
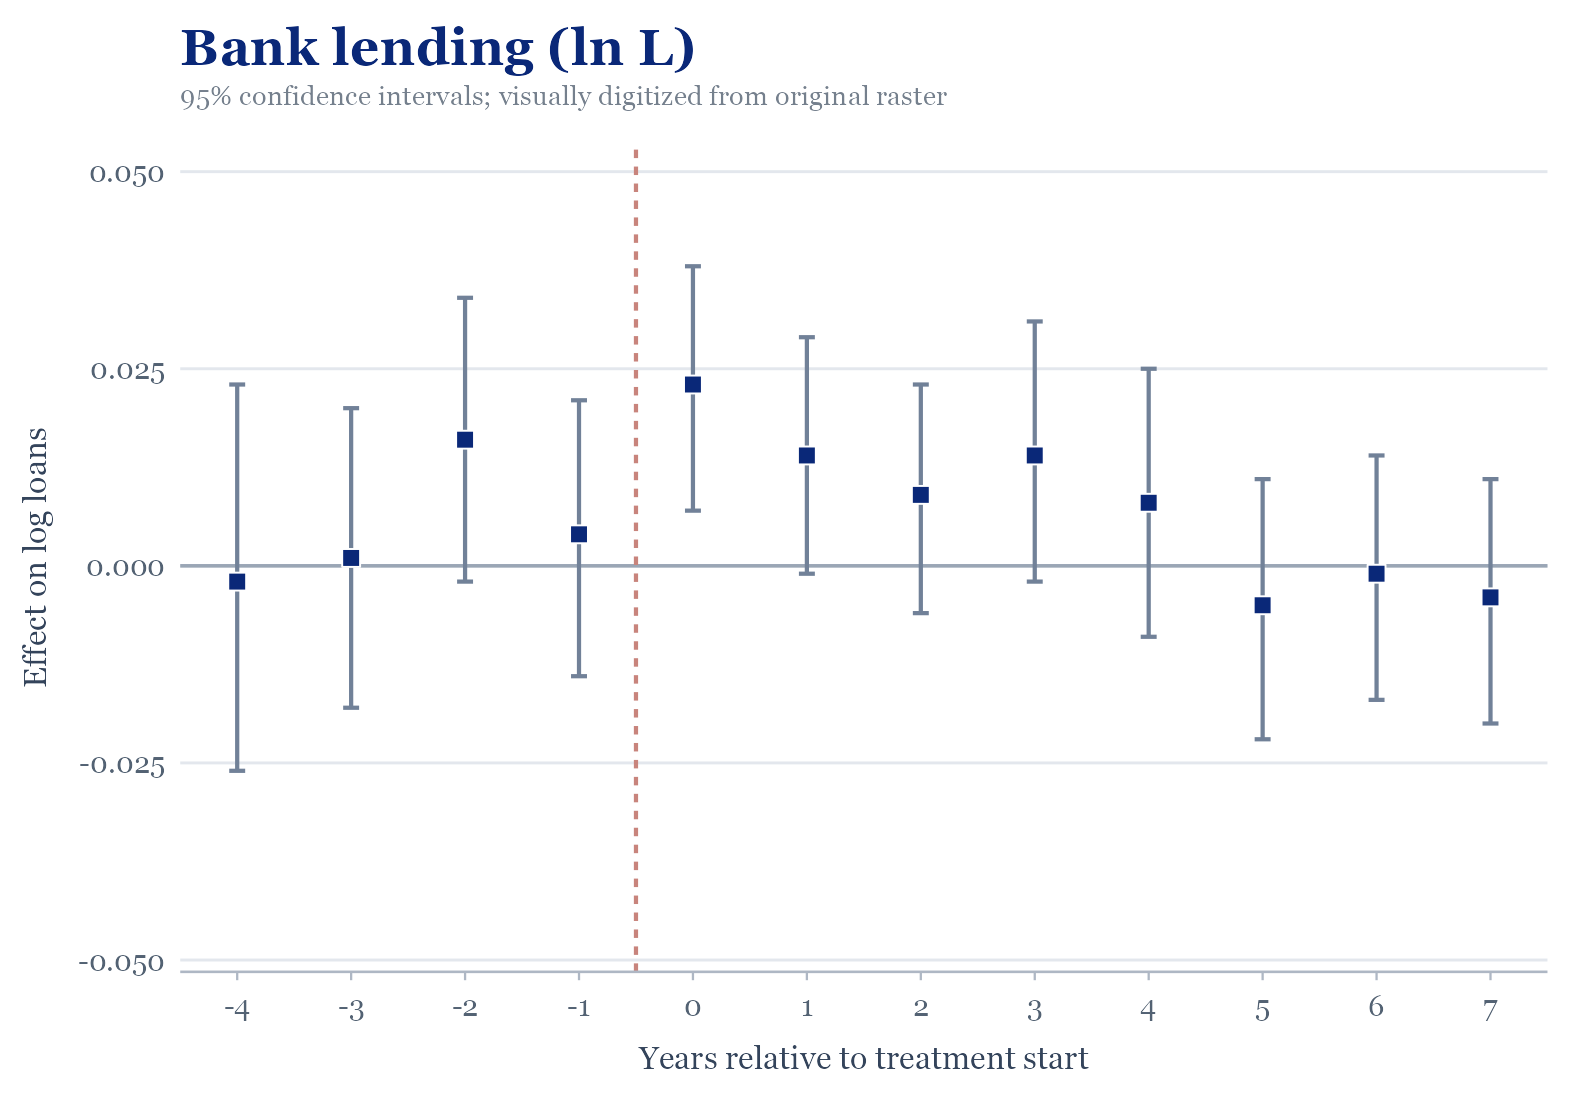
Figure 1. The figure shows the effect of the variable \( \text{Subsidy}_{b t-\tau}^{\tau} \) over time on the log-level of loans \( \ln L \) - the results from estimating the regression from Equation (6) of the paper:
\( Y_{it} = \alpha_i + \gamma_t + \beta X_{it} + \varepsilon_{it} \)
and plots the coefficient estimates for the \( \hat{\beta}_{1}^{\tau} \) coefficients and the 95% confidence bands. Subsidy exposure is based on links to subsidized firms in the first year of the subsidized project. The sample includes German savings and cooperative banks and spans the period from 1998 to 2019. Further controls include bank-level variables and averaged firm-level variables lagged by one period as those in Columns 1–5 of Table 5 of the paper. Bank and state-time fixed effects are included. See Table 2 of the paper for a detailed description of all variables.
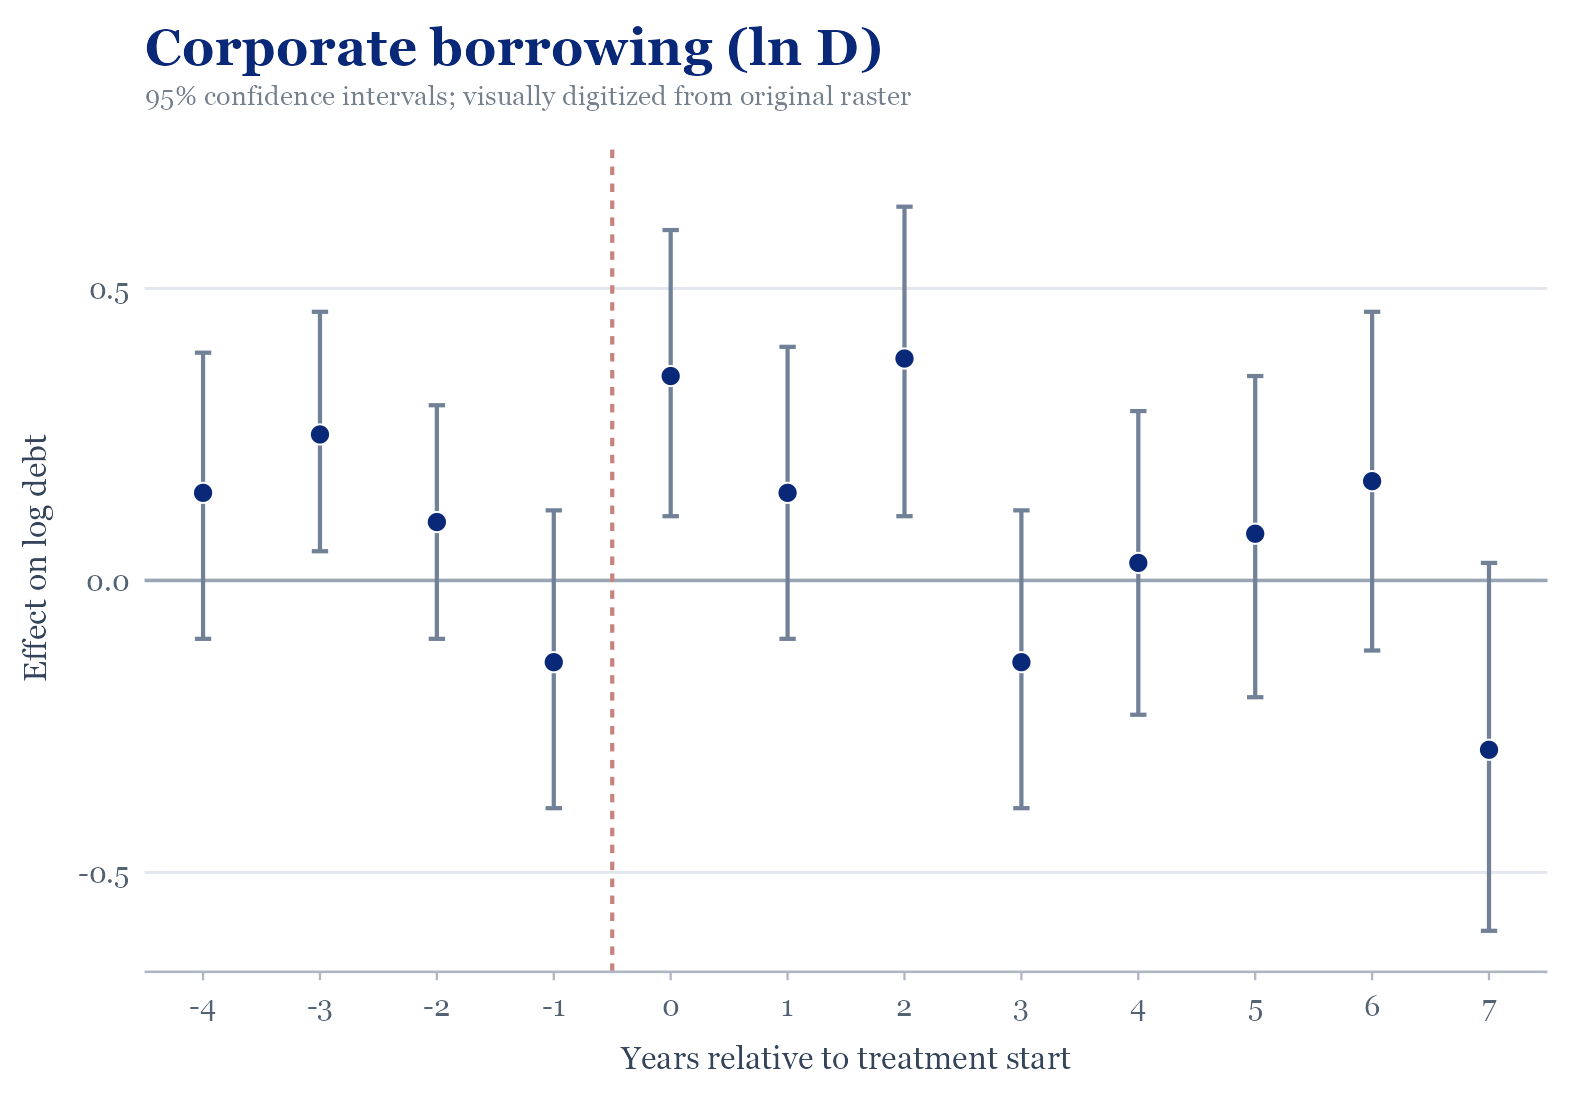
Figure 2. The figure shows the effect of the variable \( \text{Subsidy}_{f t-\tau} \) on the log-level of firms’ bank debt \( \ln D \) - the results from estimating the regression from Equation (7) of the paper:
\( Y_{it} = \alpha_i + \gamma_t + \beta X_{it} + \varepsilon_{it} \)
and plots the coefficient estimates for the \( \hat{\gamma}_{1}^{\tau} \) coefficients and the 95% confidence bands. The firm sample includes German firms and spans the period from 2002 to 2020 including a treatment group of subsidized firms and a control group of firms of the same 3-digit NACE industry matched using the coarsened exact matching approach based on the values of firms’ assets, cash ratio, capitalization, and fixed assets growth (%) as of one year before the firm received the subsidy. Further controls include firm-level variables lagged by one period. Firm and time fixed effects are included and standard errors are clustered at the firm level. See Table 2 of the paper for a detailed description of all variables.
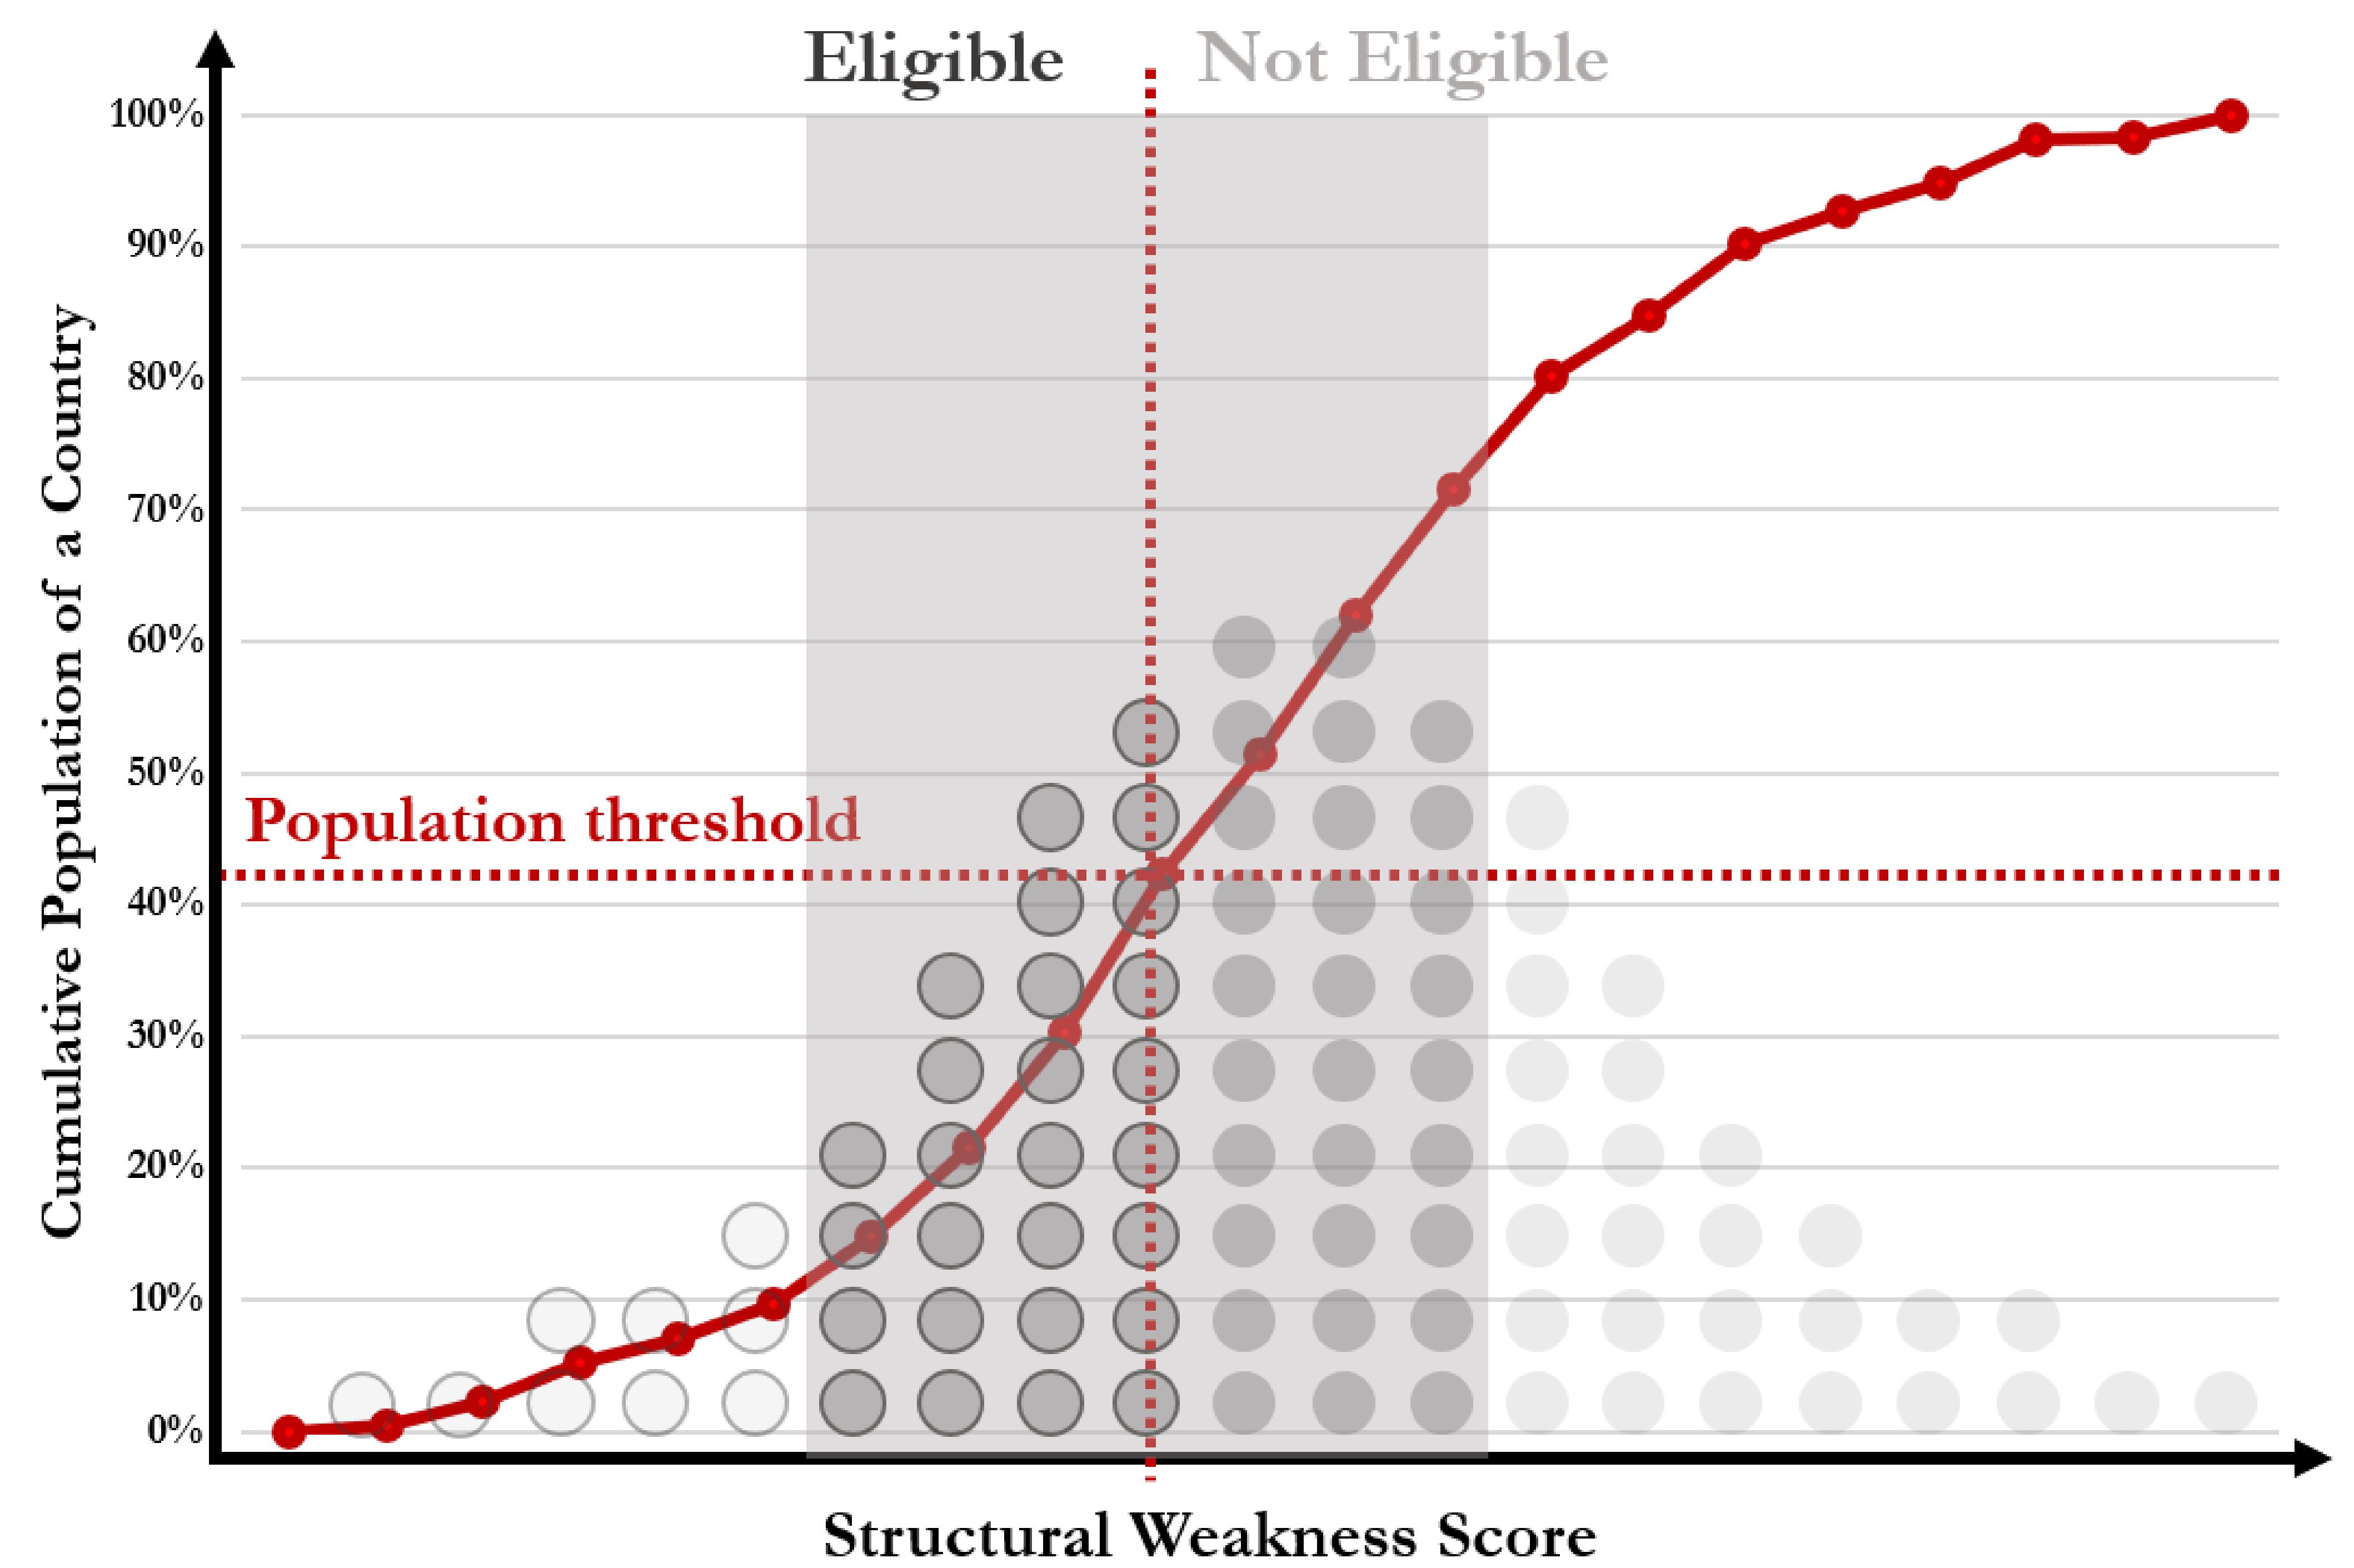
Figure 3. The figure illustrates the two key factors driving whether regions are eligible for the subsidy program. The x-axis depicts the structural weakness score assigned to labor market regions, the lower it is, the weaker is the region. The y-axis depicts the cumulative population share in a country’s total population. For Germany, this score is close to 40% across all years. All regions in the left part are eligible due to a low weakness score and because the population threshold has not yet been hit.
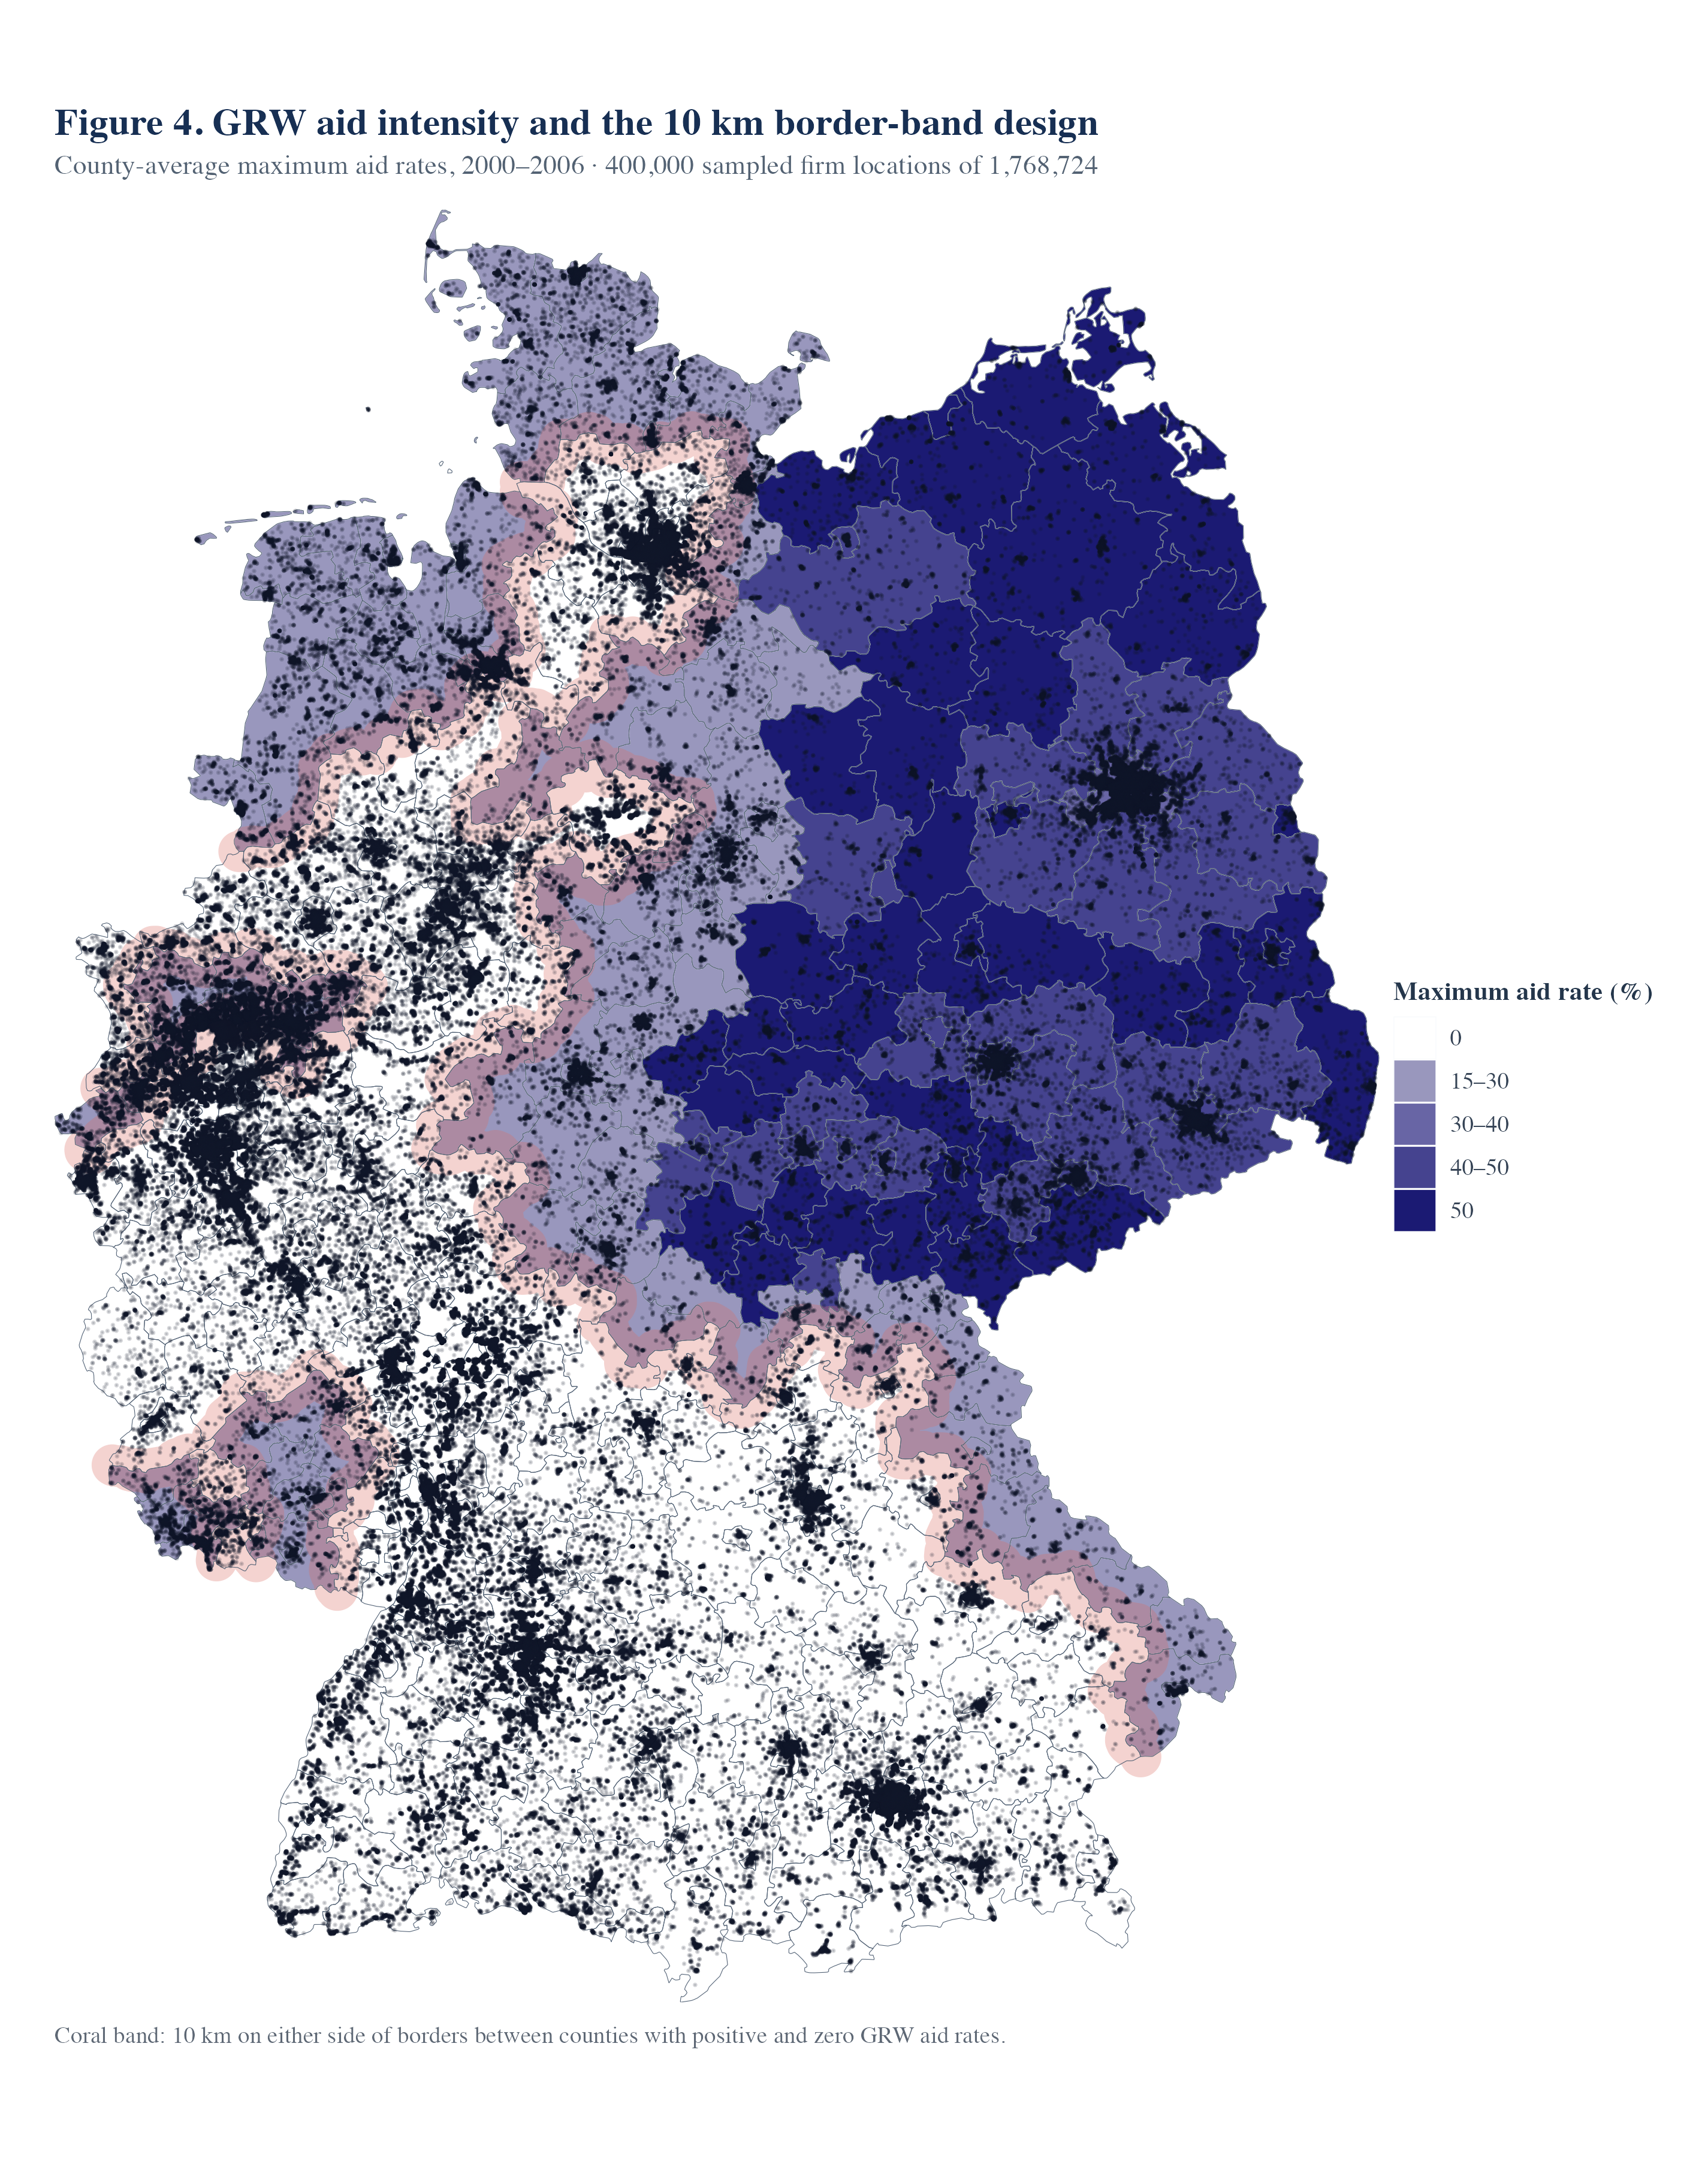
Figure 4. County fills show mean maximum GRW aid rates over 2000–2006; zero-rate counties are white. Coral bands mark the areas within 10 km on either side of borders between positive-rate and zero-rate counties. Points show a reproducible sample of 400,000 locations from 1,768,724 accepted Amadeus geocodes. These are firm snapshot locations, not historical positions.
Quo Vadis? Bank Closures, Firm Performance, and New Bank-Firm Relationships
PDF
› abstract
Abstract: How do firms respond to sudden and forcible closures of their lenders? Using unique credit register data from a setting where two-thirds of banks were closed within a decade, we find that neither bad nor good firms delay repayments or switch lenders before closures. Afterward, bad firms lose subsidized credit and experience sharp declines in employment, borrowing, and sales, while good firms improve performance. This divergence stems from banks’ prior underpricing of bad firms’ credit risk. Ultimately, good firms match with new solid banks, while bad firms gravitate toward not-yet-detected weak banks—especially where boards overlap or markets are unconcentrated.
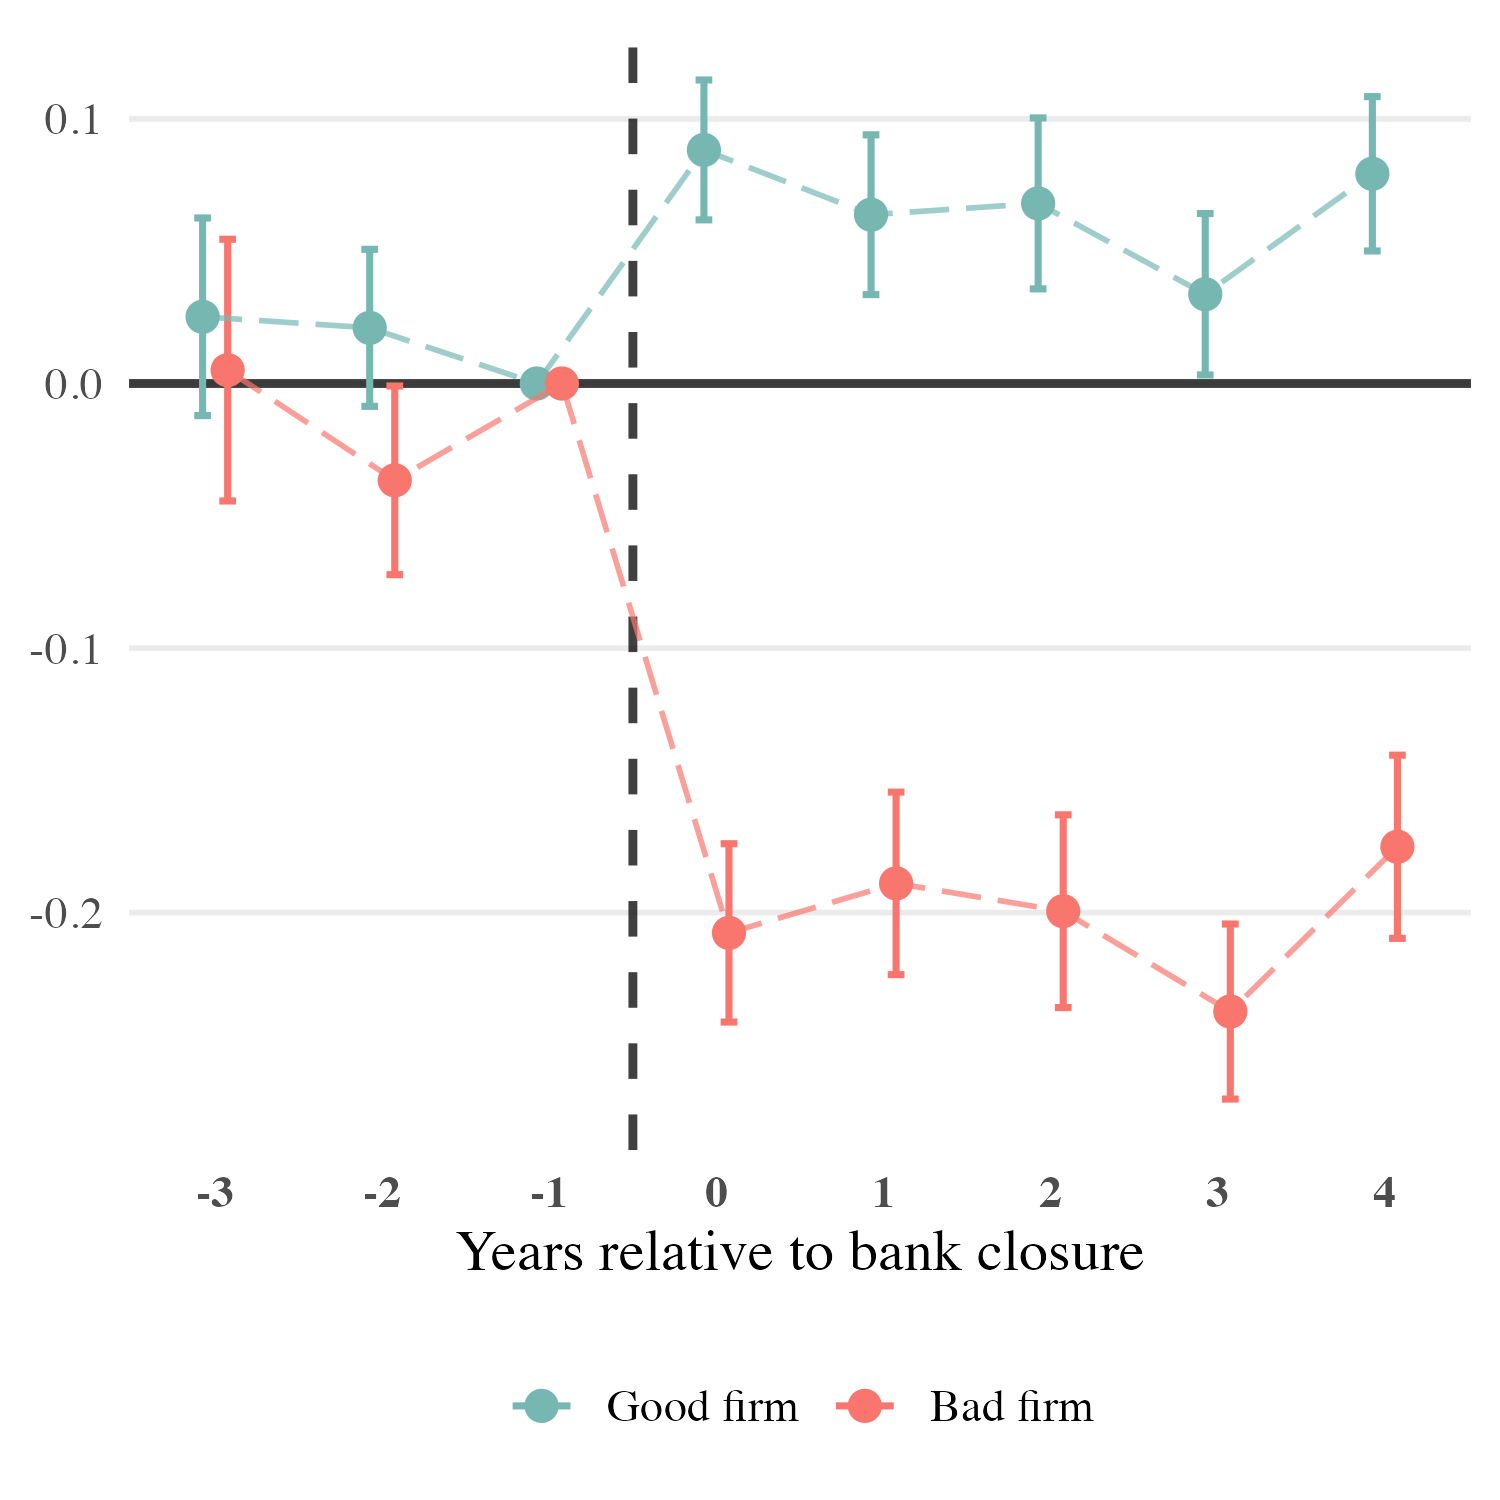
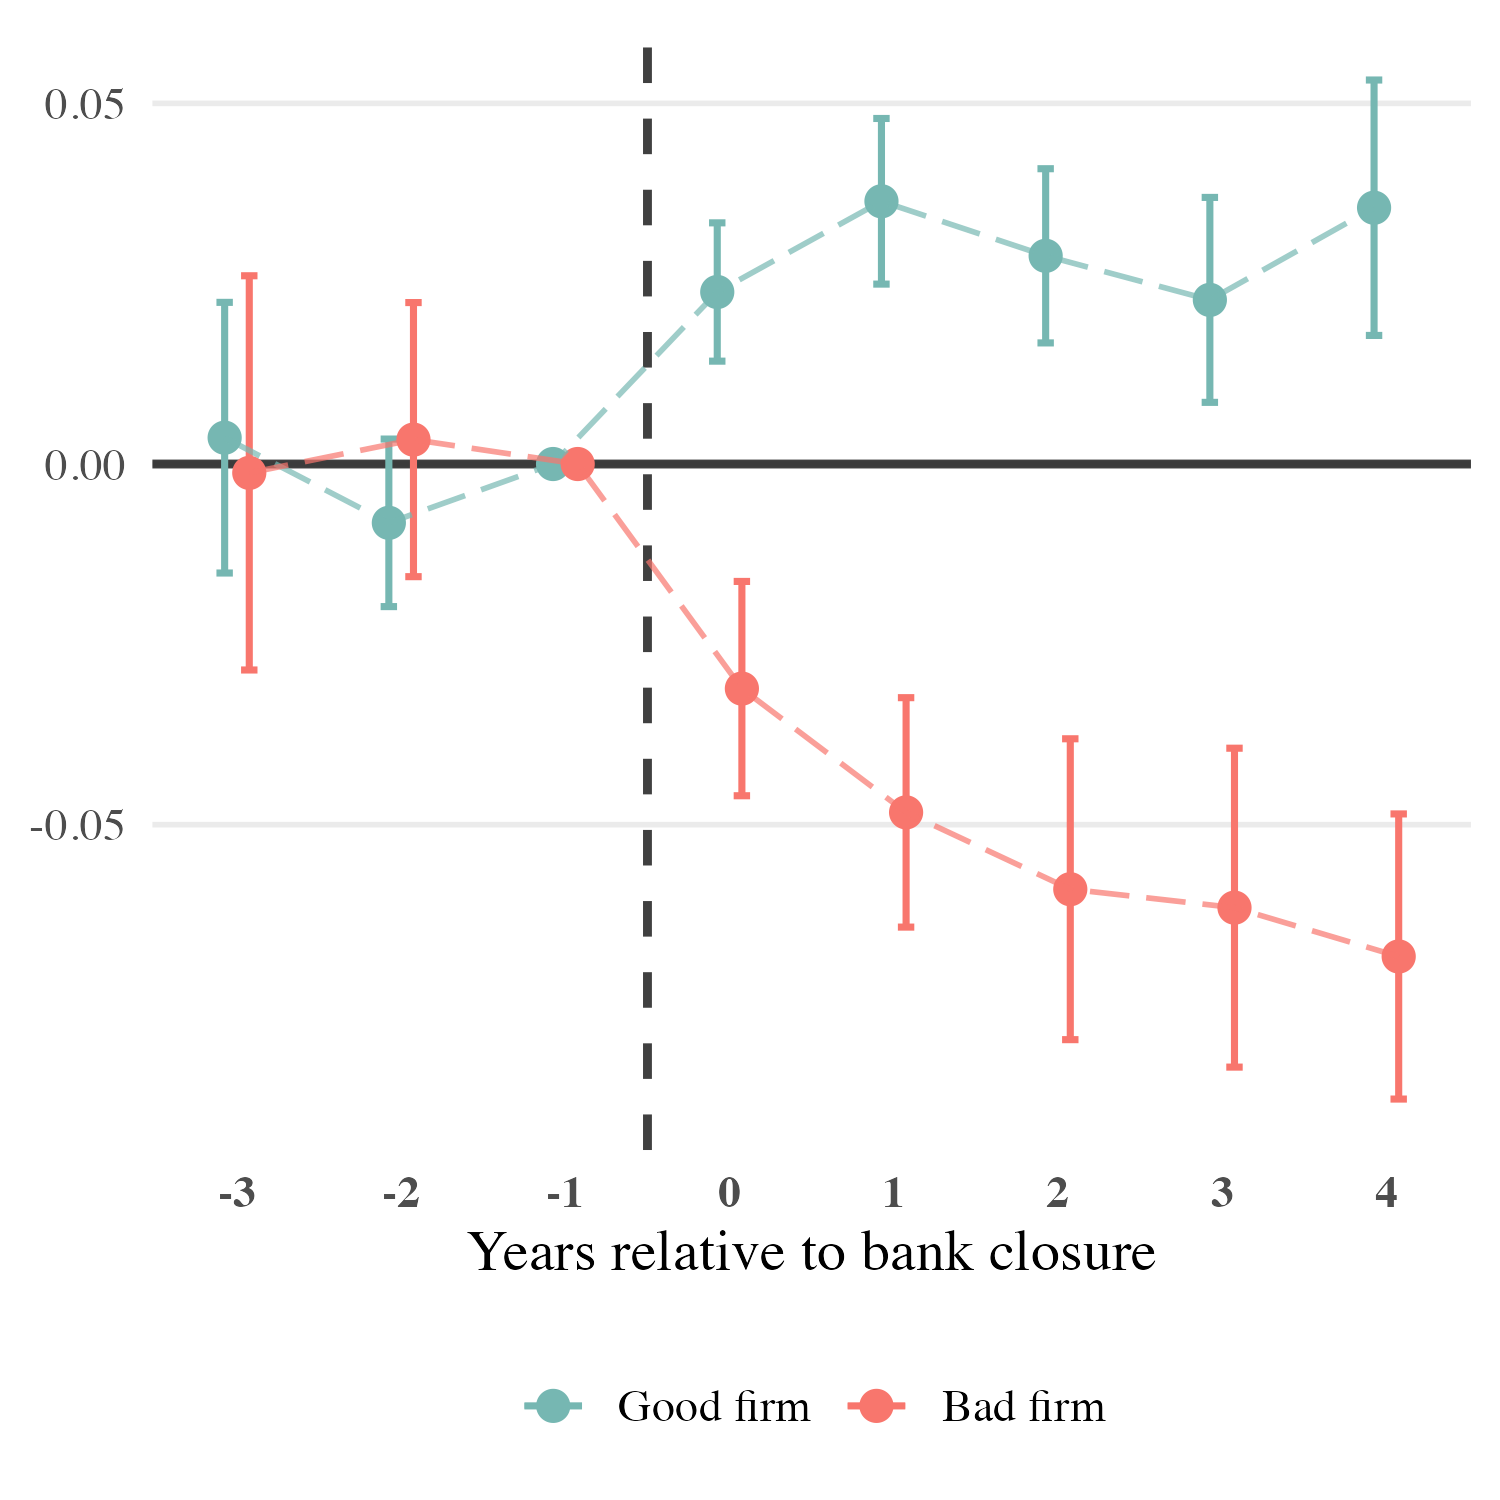
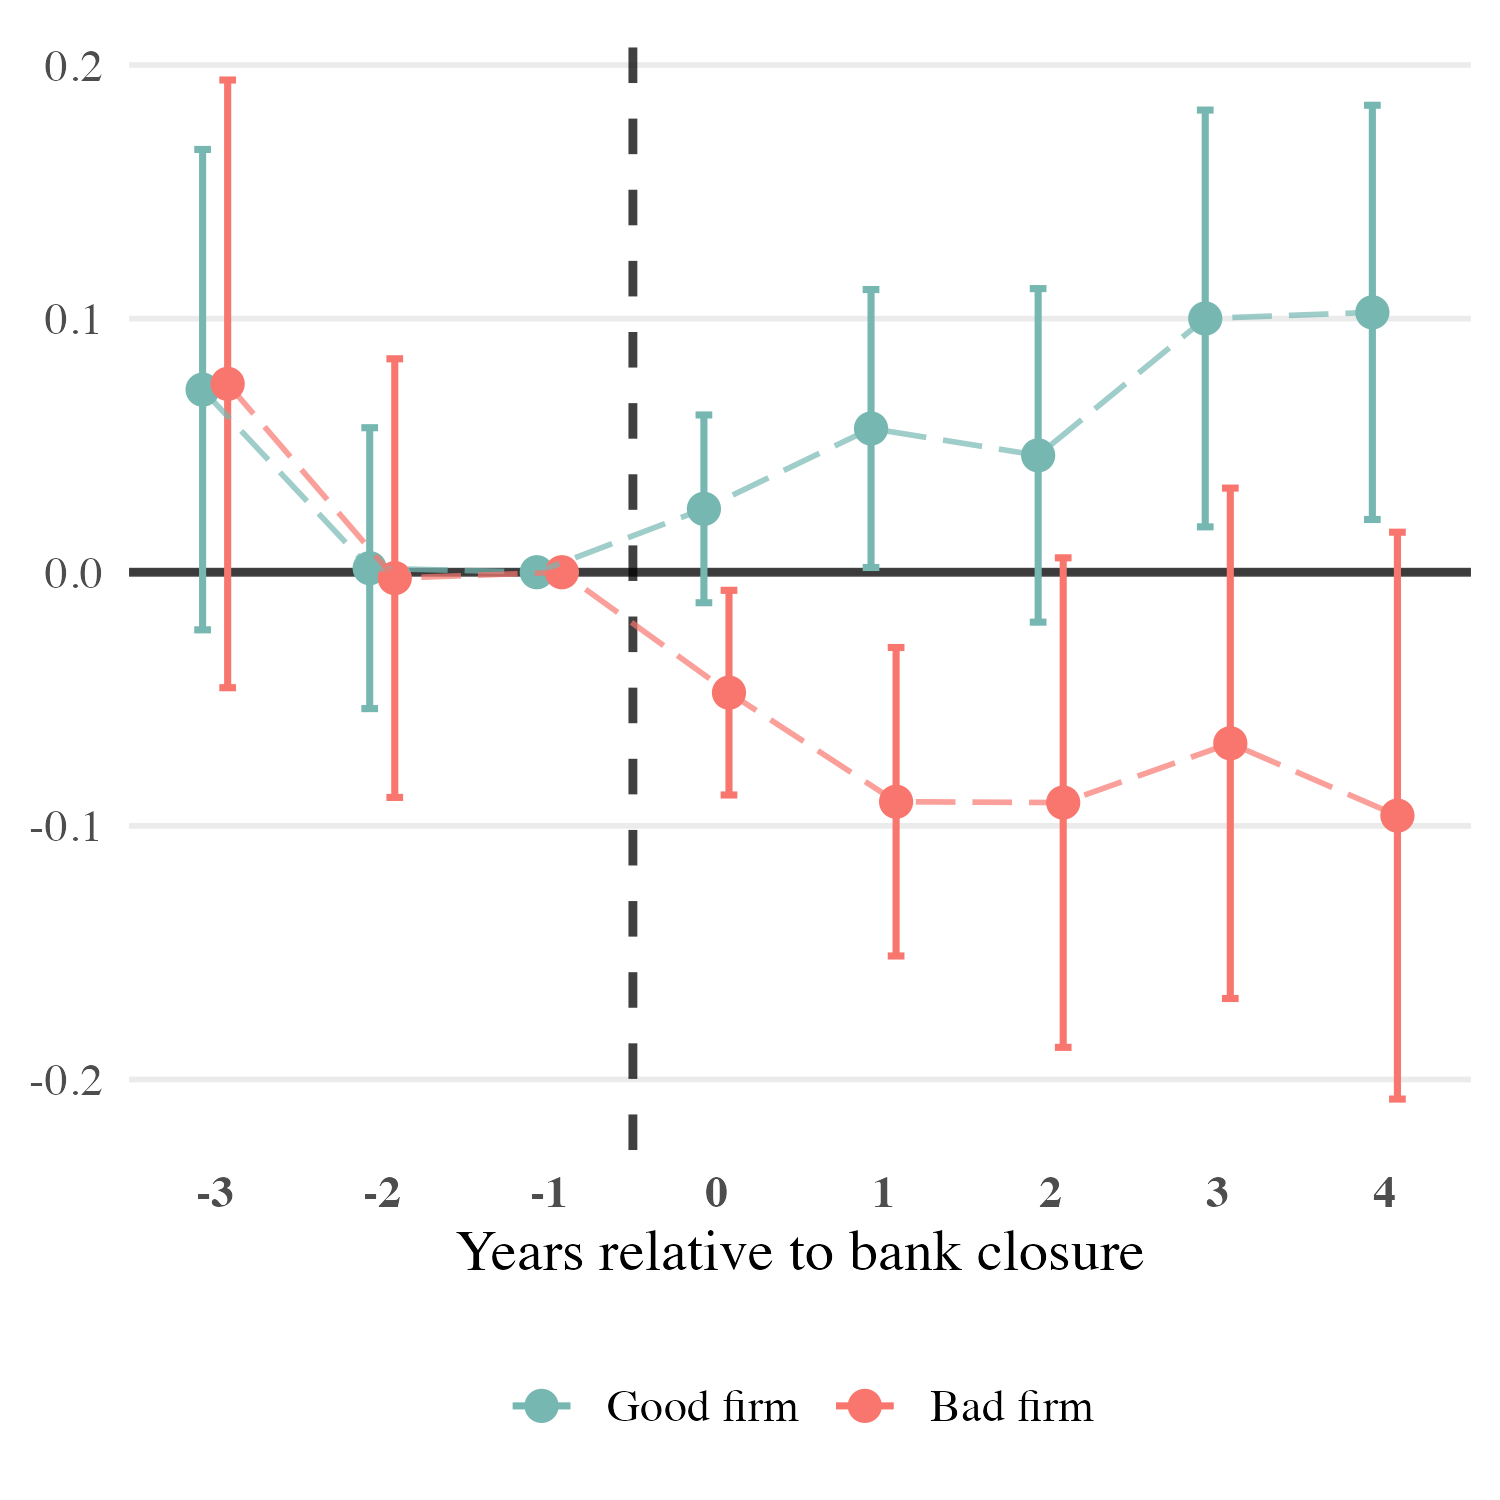
Figure 1. This figure presents the results of the firm-level event-study analysis by depicting the values of event-time coefficients \( \beta_{\tau} \) (green) and \( \gamma_{\tau} \) (red) of the event-study regression below:
\[ \begin{aligned} Y_{f,t} =\;& \alpha_f + \gamma_{s,t} + \lambda_{r,t} \\ &+ \sum_{\tau \neq -1} \beta_{\tau}\, \mathrm{BankClosure}_{m,t} \times \mathbf{1}\{t=\tau\}_{m,t} \\ &+ \sum_{\tau \neq -1} \gamma_{\tau}\, \mathrm{BankClosure}_{m,t} \times \mathbf{1}\{t=\tau\}_{m,t} \times \mathrm{BadFirm}_{f,t} \\ &+ \mathbf{X}_{f,t-1}\mathbf{\Theta}' + \varepsilon_{f,t} \end{aligned} \] where the former and the latter capturing respectively: the direct response of 'good' firms to the fact of bank closure in municipality of its location at time \( t \), as well as the differencial response of the 'bad' firms. Firm is labelled 'bad' if it is classified as high-risk according to Zmijewski bankruptcy prediction model.
\[ \begin{aligned} Y_{f,t} =\;& \alpha_f + \gamma_{s,t} + \lambda_{r,t} \\ &+ \sum_{\tau \neq -1} \beta_{\tau}\, \mathrm{BankClosure}_{m,t} \times \mathbf{1}\{t=\tau\}_{m,t} \\ &+ \sum_{\tau \neq -1} \gamma_{\tau}\, \mathrm{BankClosure}_{m,t} \times \mathbf{1}\{t=\tau\}_{m,t} \times \mathrm{BadFirm}_{f,t} \\ &+ \mathbf{X}_{f,t-1}\mathbf{\Theta}' + \varepsilon_{f,t} \end{aligned} \] where the former and the latter capturing respectively: the direct response of 'good' firms to the fact of bank closure in municipality of its location at time \( t \), as well as the differencial response of the 'bad' firms. Firm is labelled 'bad' if it is classified as high-risk according to Zmijewski bankruptcy prediction model.
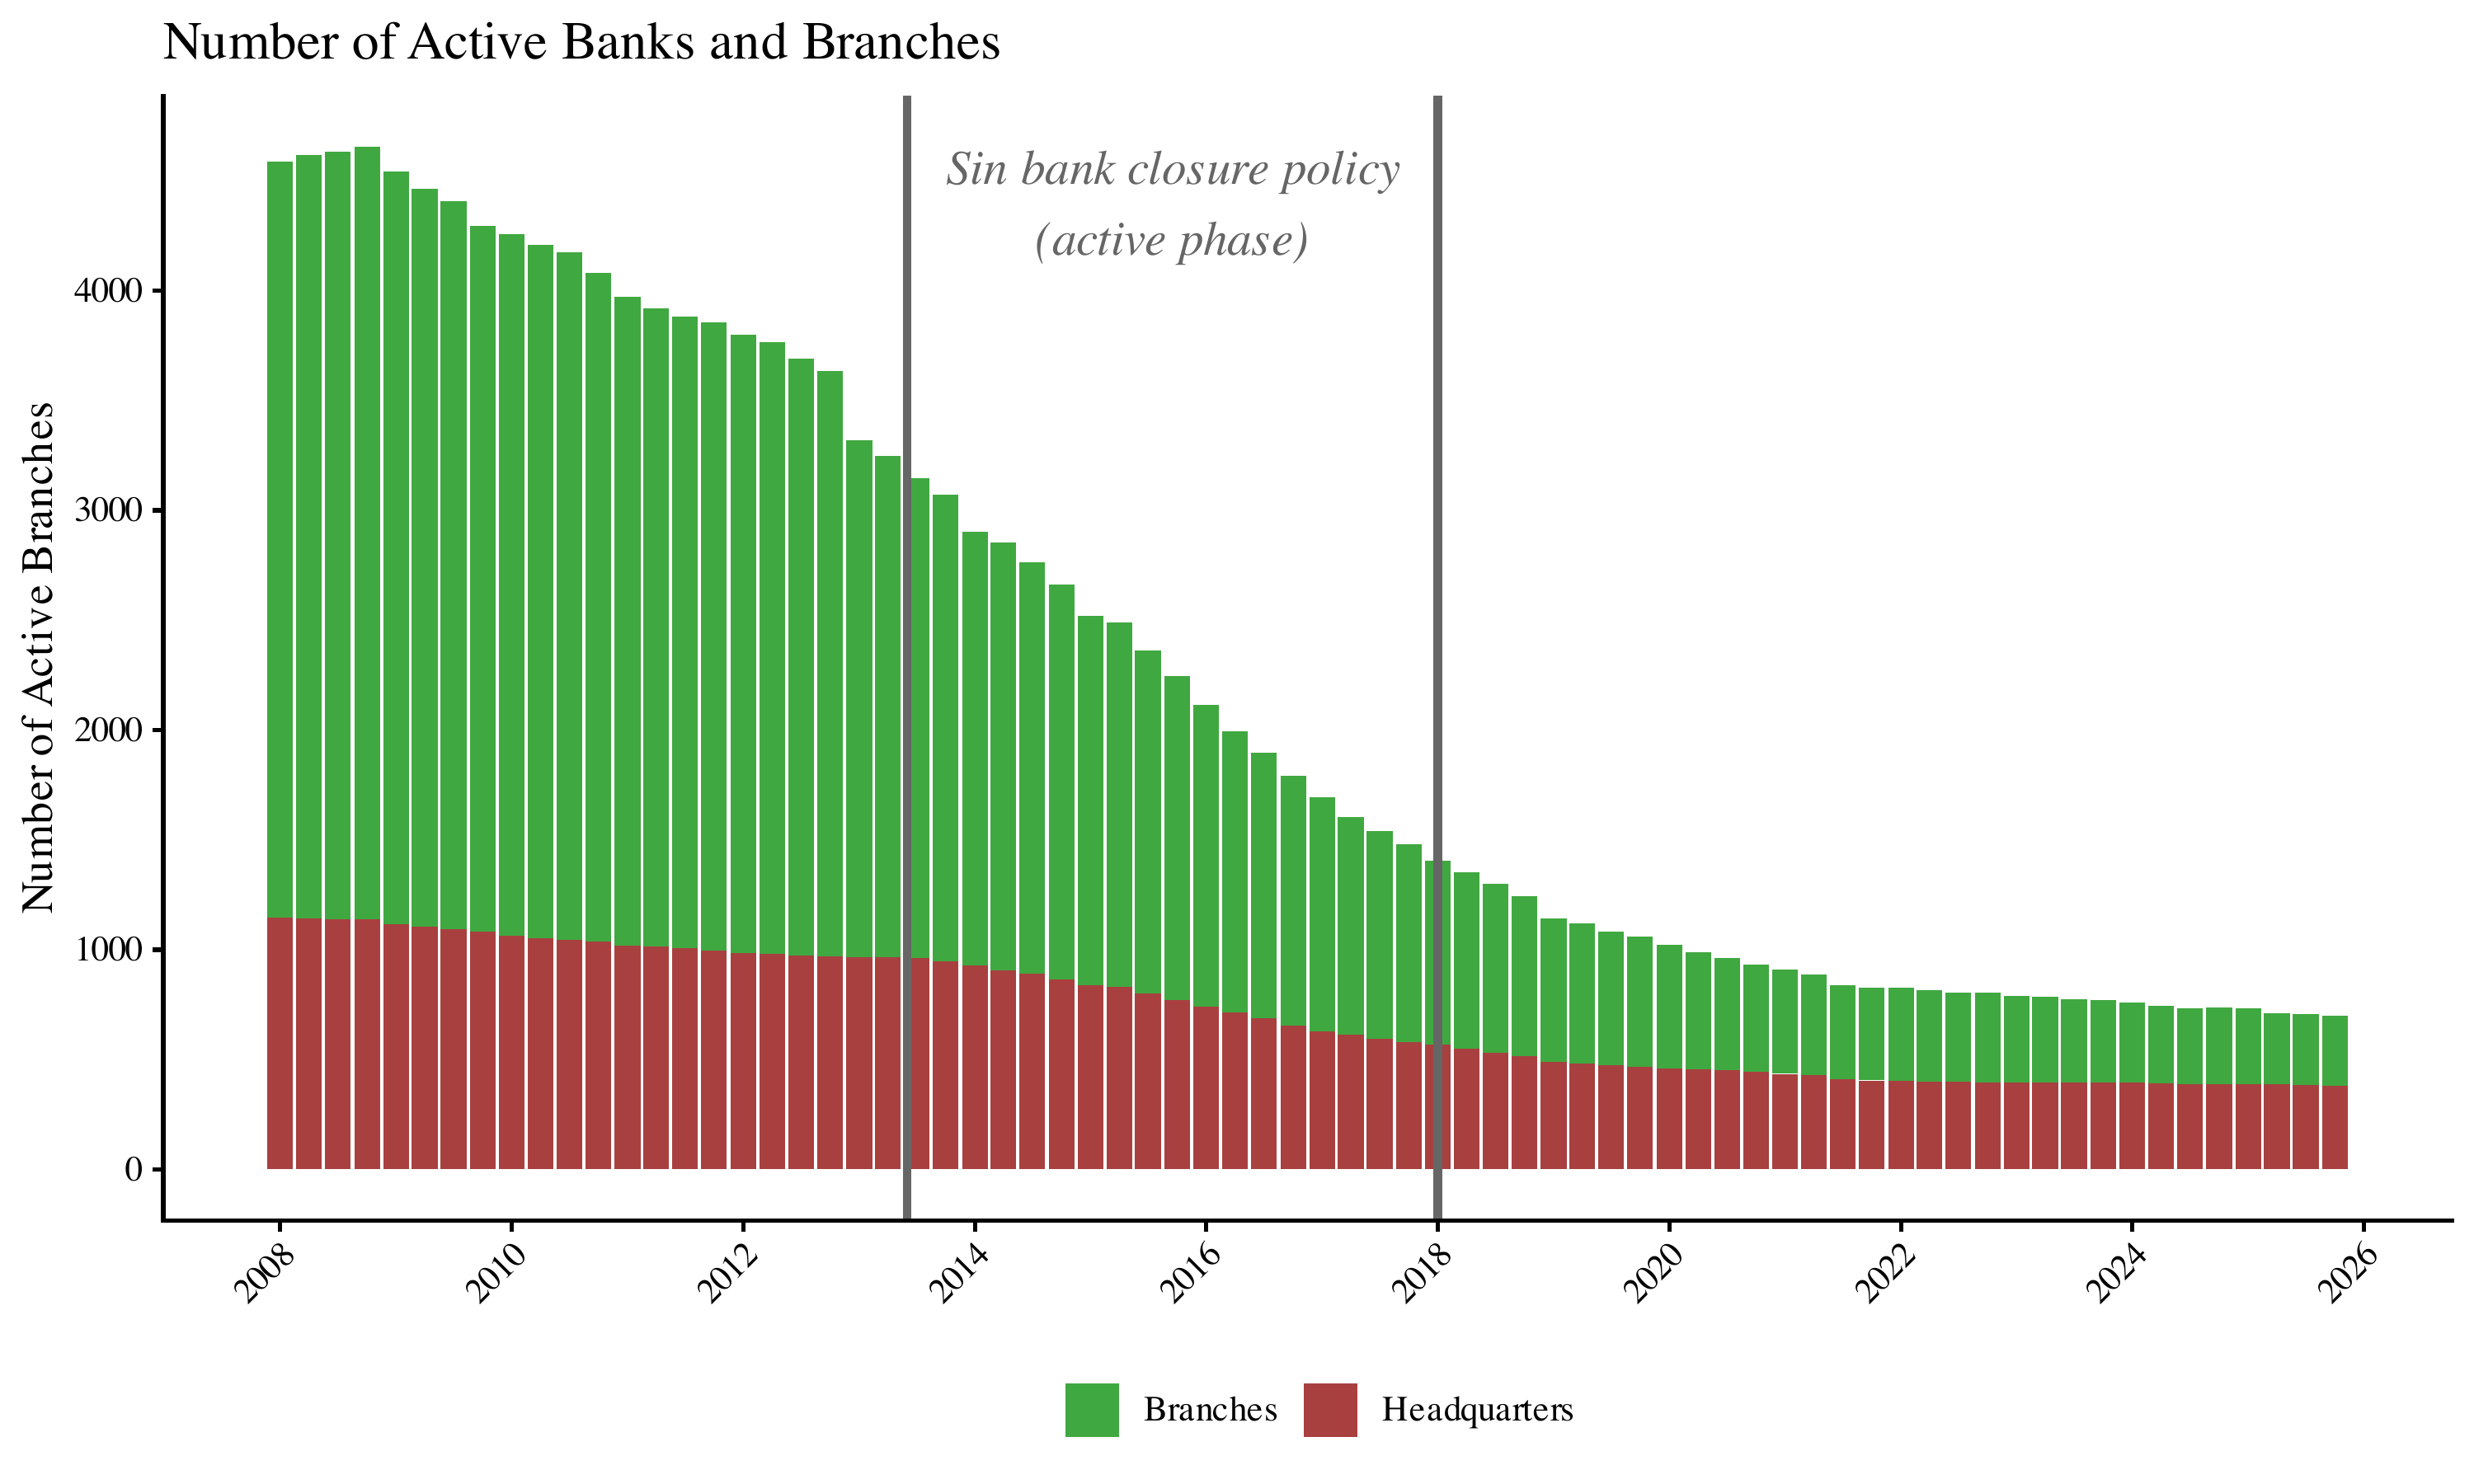
Figure 2. Number of active bank branches and headquarters in Russia. Click the figure to open the vector PDF.
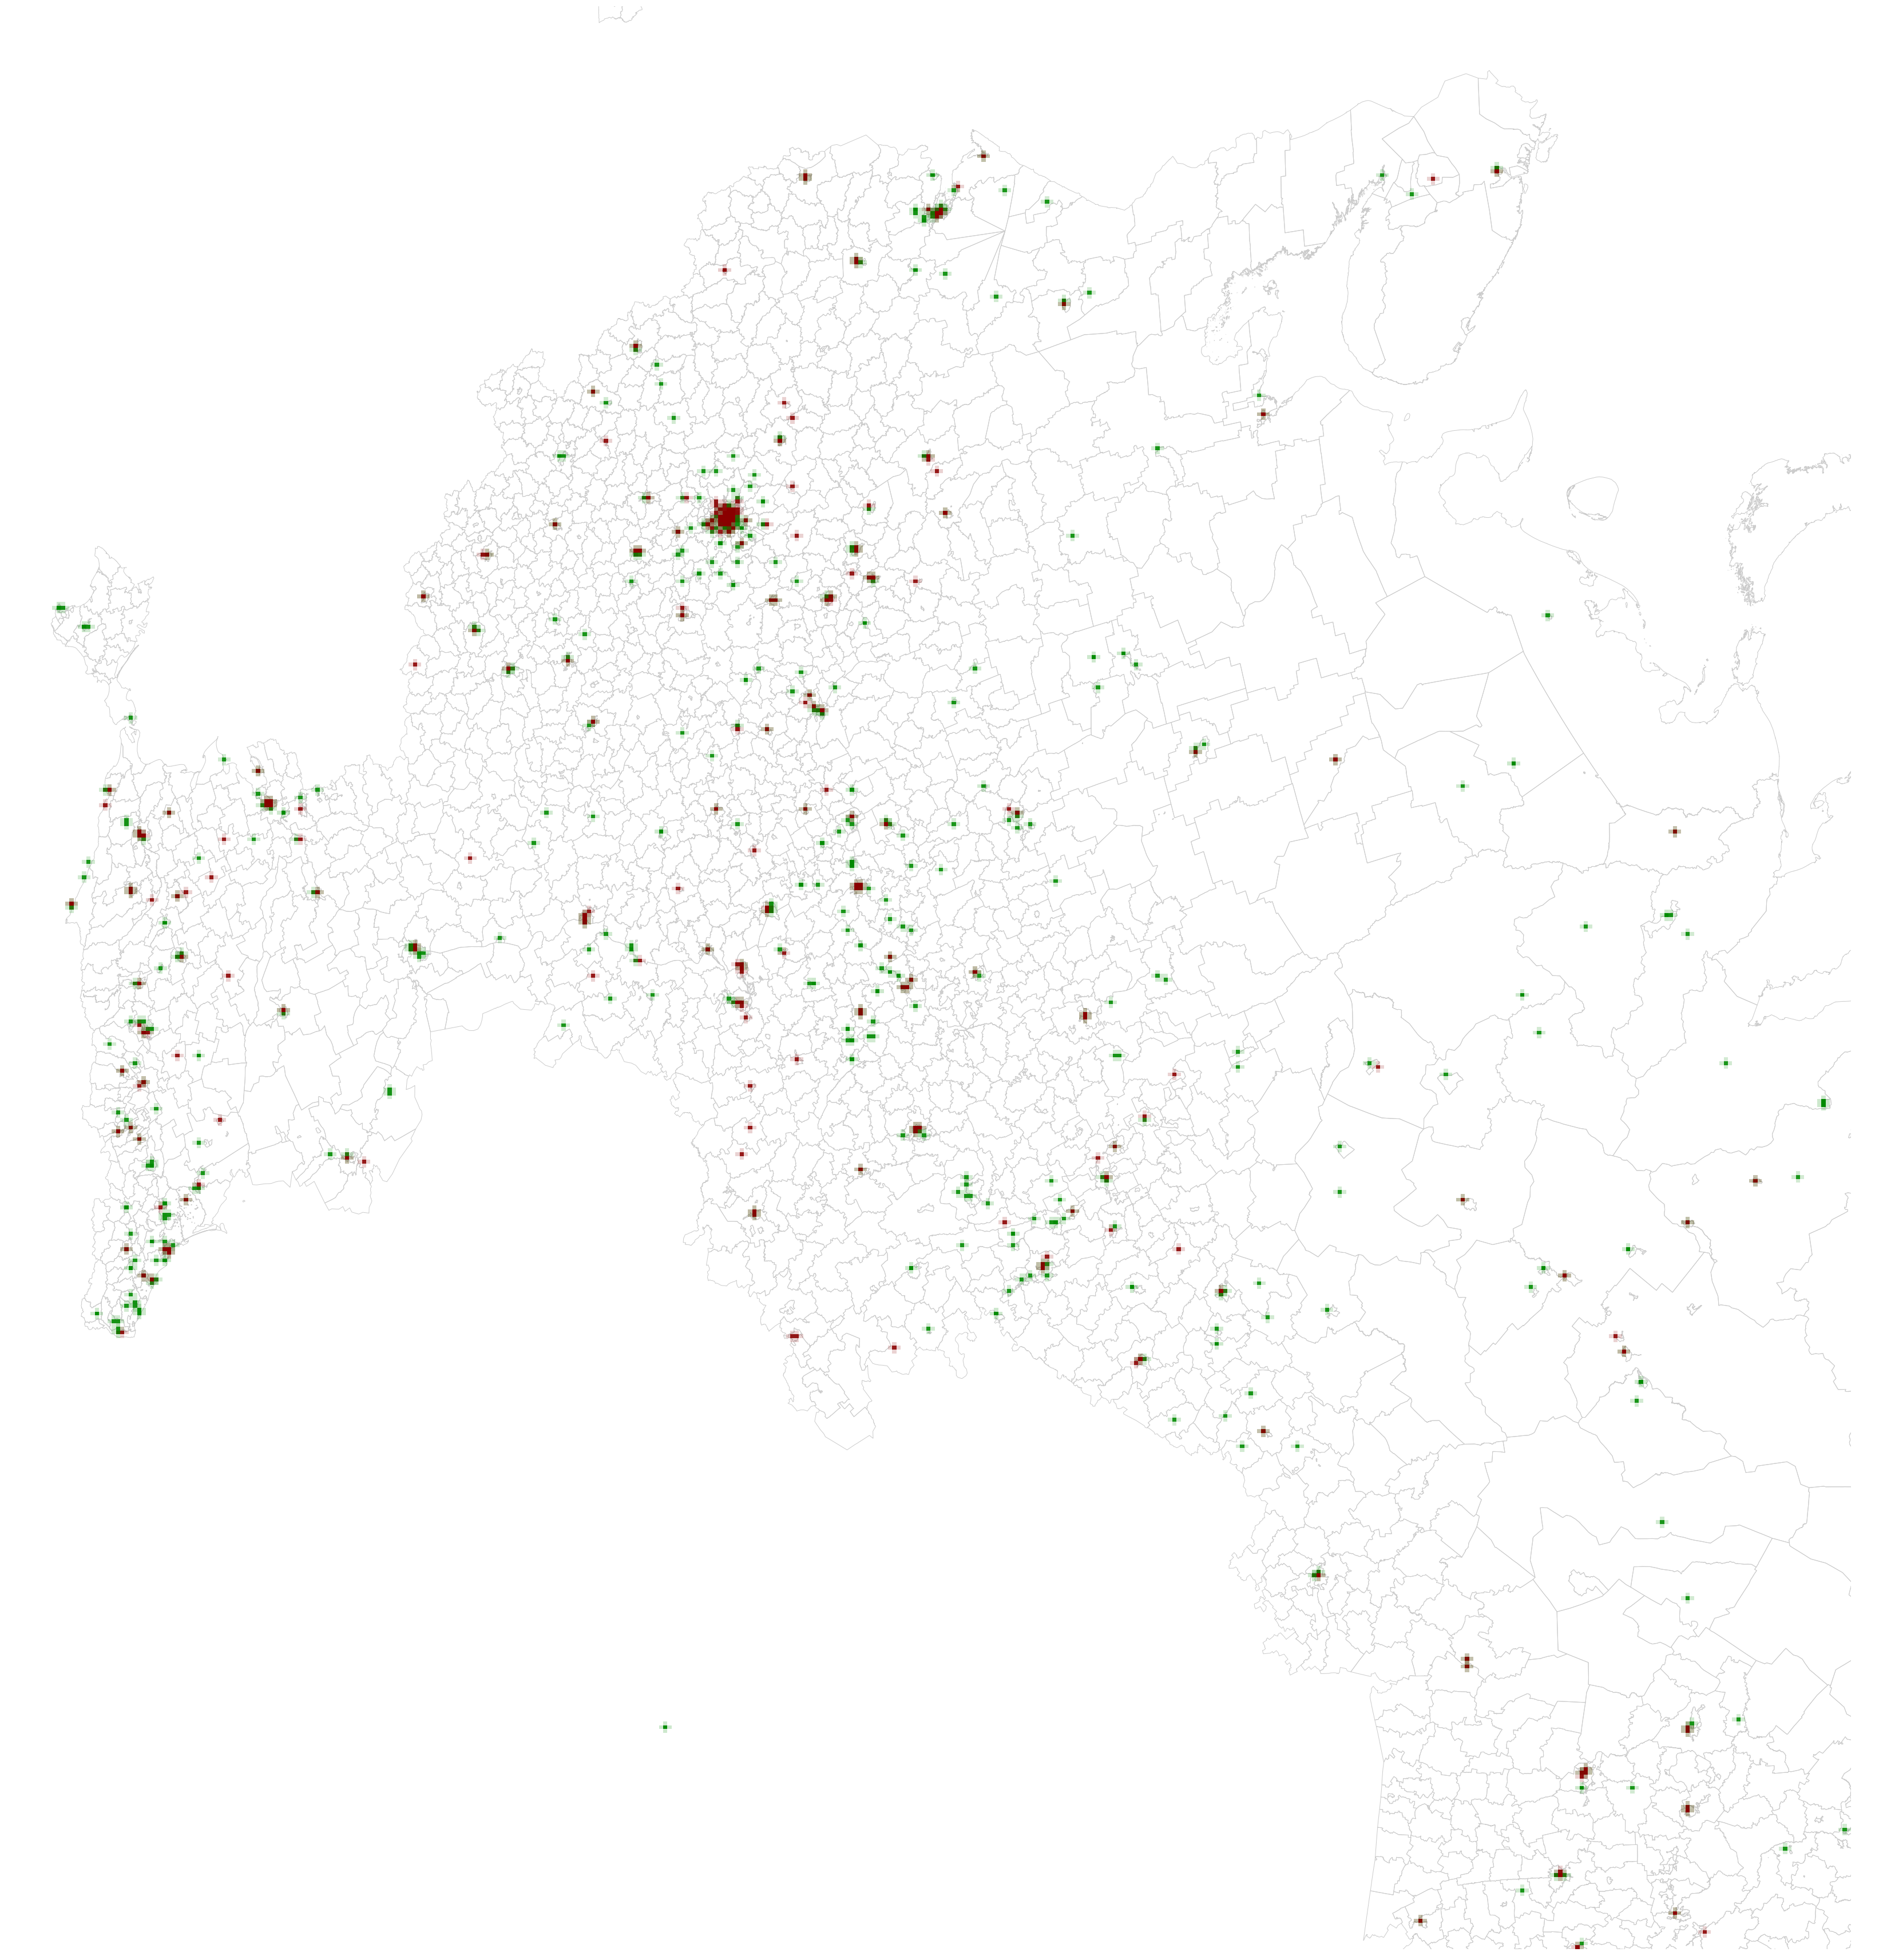
Figure 3. The map illustrates geographical distribution of Russian banking system based on geolocated addresses of all Russian banks' headquarters and branches as of Q1 2013. Red and green dots represent bank headquarters and branches, respectively.
Invisible Lines: How Banks Use Firm Networks to Blunt Supervisory Tightening
PDF
› abstract
Abstract: When supervision tightens, do bank owners adjust through connected firms? We study Russian banks around entry into the top quartile of predicted licence-revocation risk, linking bank accounts, ownership records and firm statements. Bank balance-sheet paths differ with pre-existing network reach. The current sibling direct-share measure rises by 0.74 percentage points over eight quarters; other ownership margins are inconclusive. Firm accounts provide only partial corroboration. The estimates suggest adjustment in owners’ portfolios but do not establish transfers beyond supervision. Retrospective score construction and differences across the current samples limit causal interpretation.
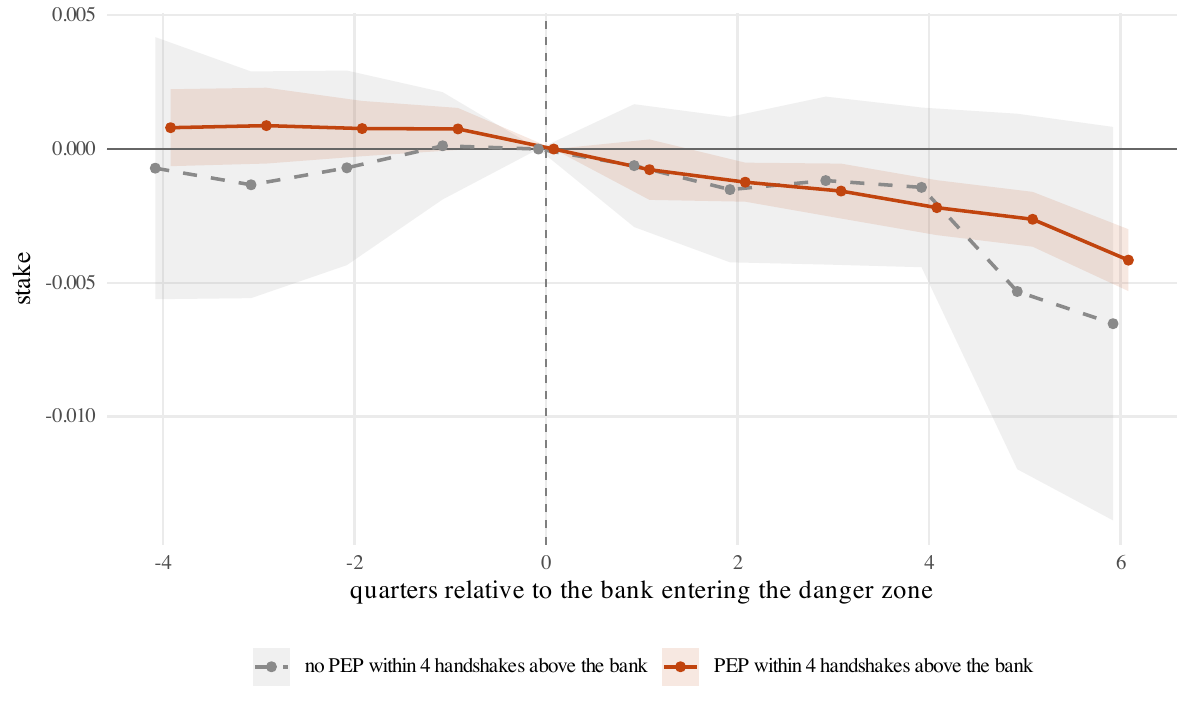
Bank-owned firms
Bank → firm
Bank → firm
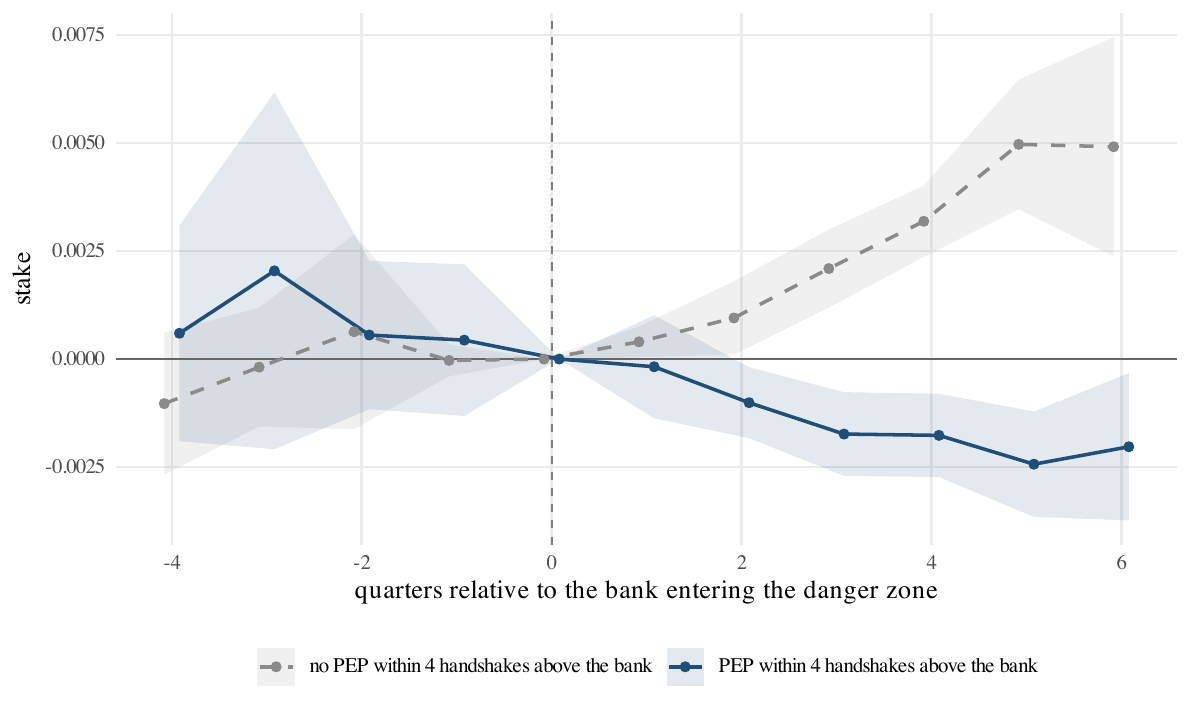
Stakes in the bank
Firm → bank
Firm → bank
The bank’s sister firms
Common owner → other firm
Common owner → other firm
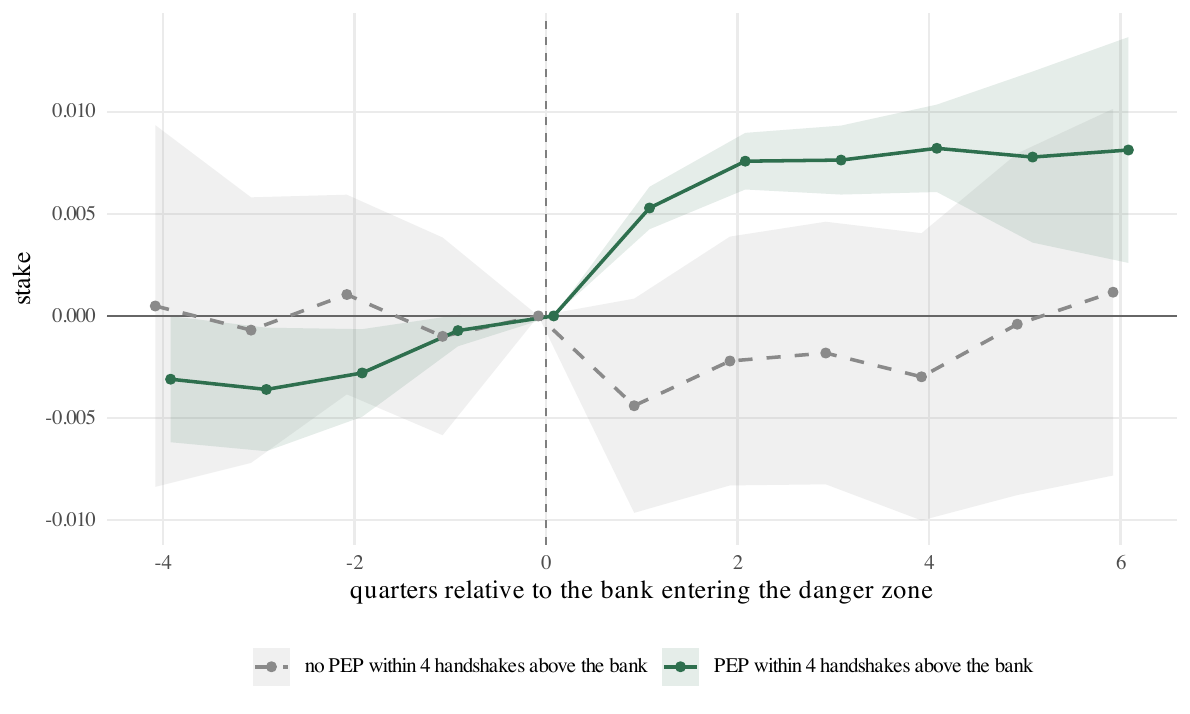
Figure 1. Event-study estimates of ownership-stake adjustments around a bank’s entry into the supervisory danger zone. Read left to right: bank-owned firms (bank → firm), stakes in the bank (firm → bank), and the bank’s sister firms (a common owner holds both the bank and the other firm). This sequence traces a potential route for shifting ownership exposure beyond the bank’s direct firm links; it does not directly measure cash or capital transfers. Each graph compares banks with a politically exposed person (PEP) within four ownership or control steps above the bank (solid colored line) with banks without such a link (gray dashed line). Shaded bands are confidence intervals. Click any graph to open its vector PDF.
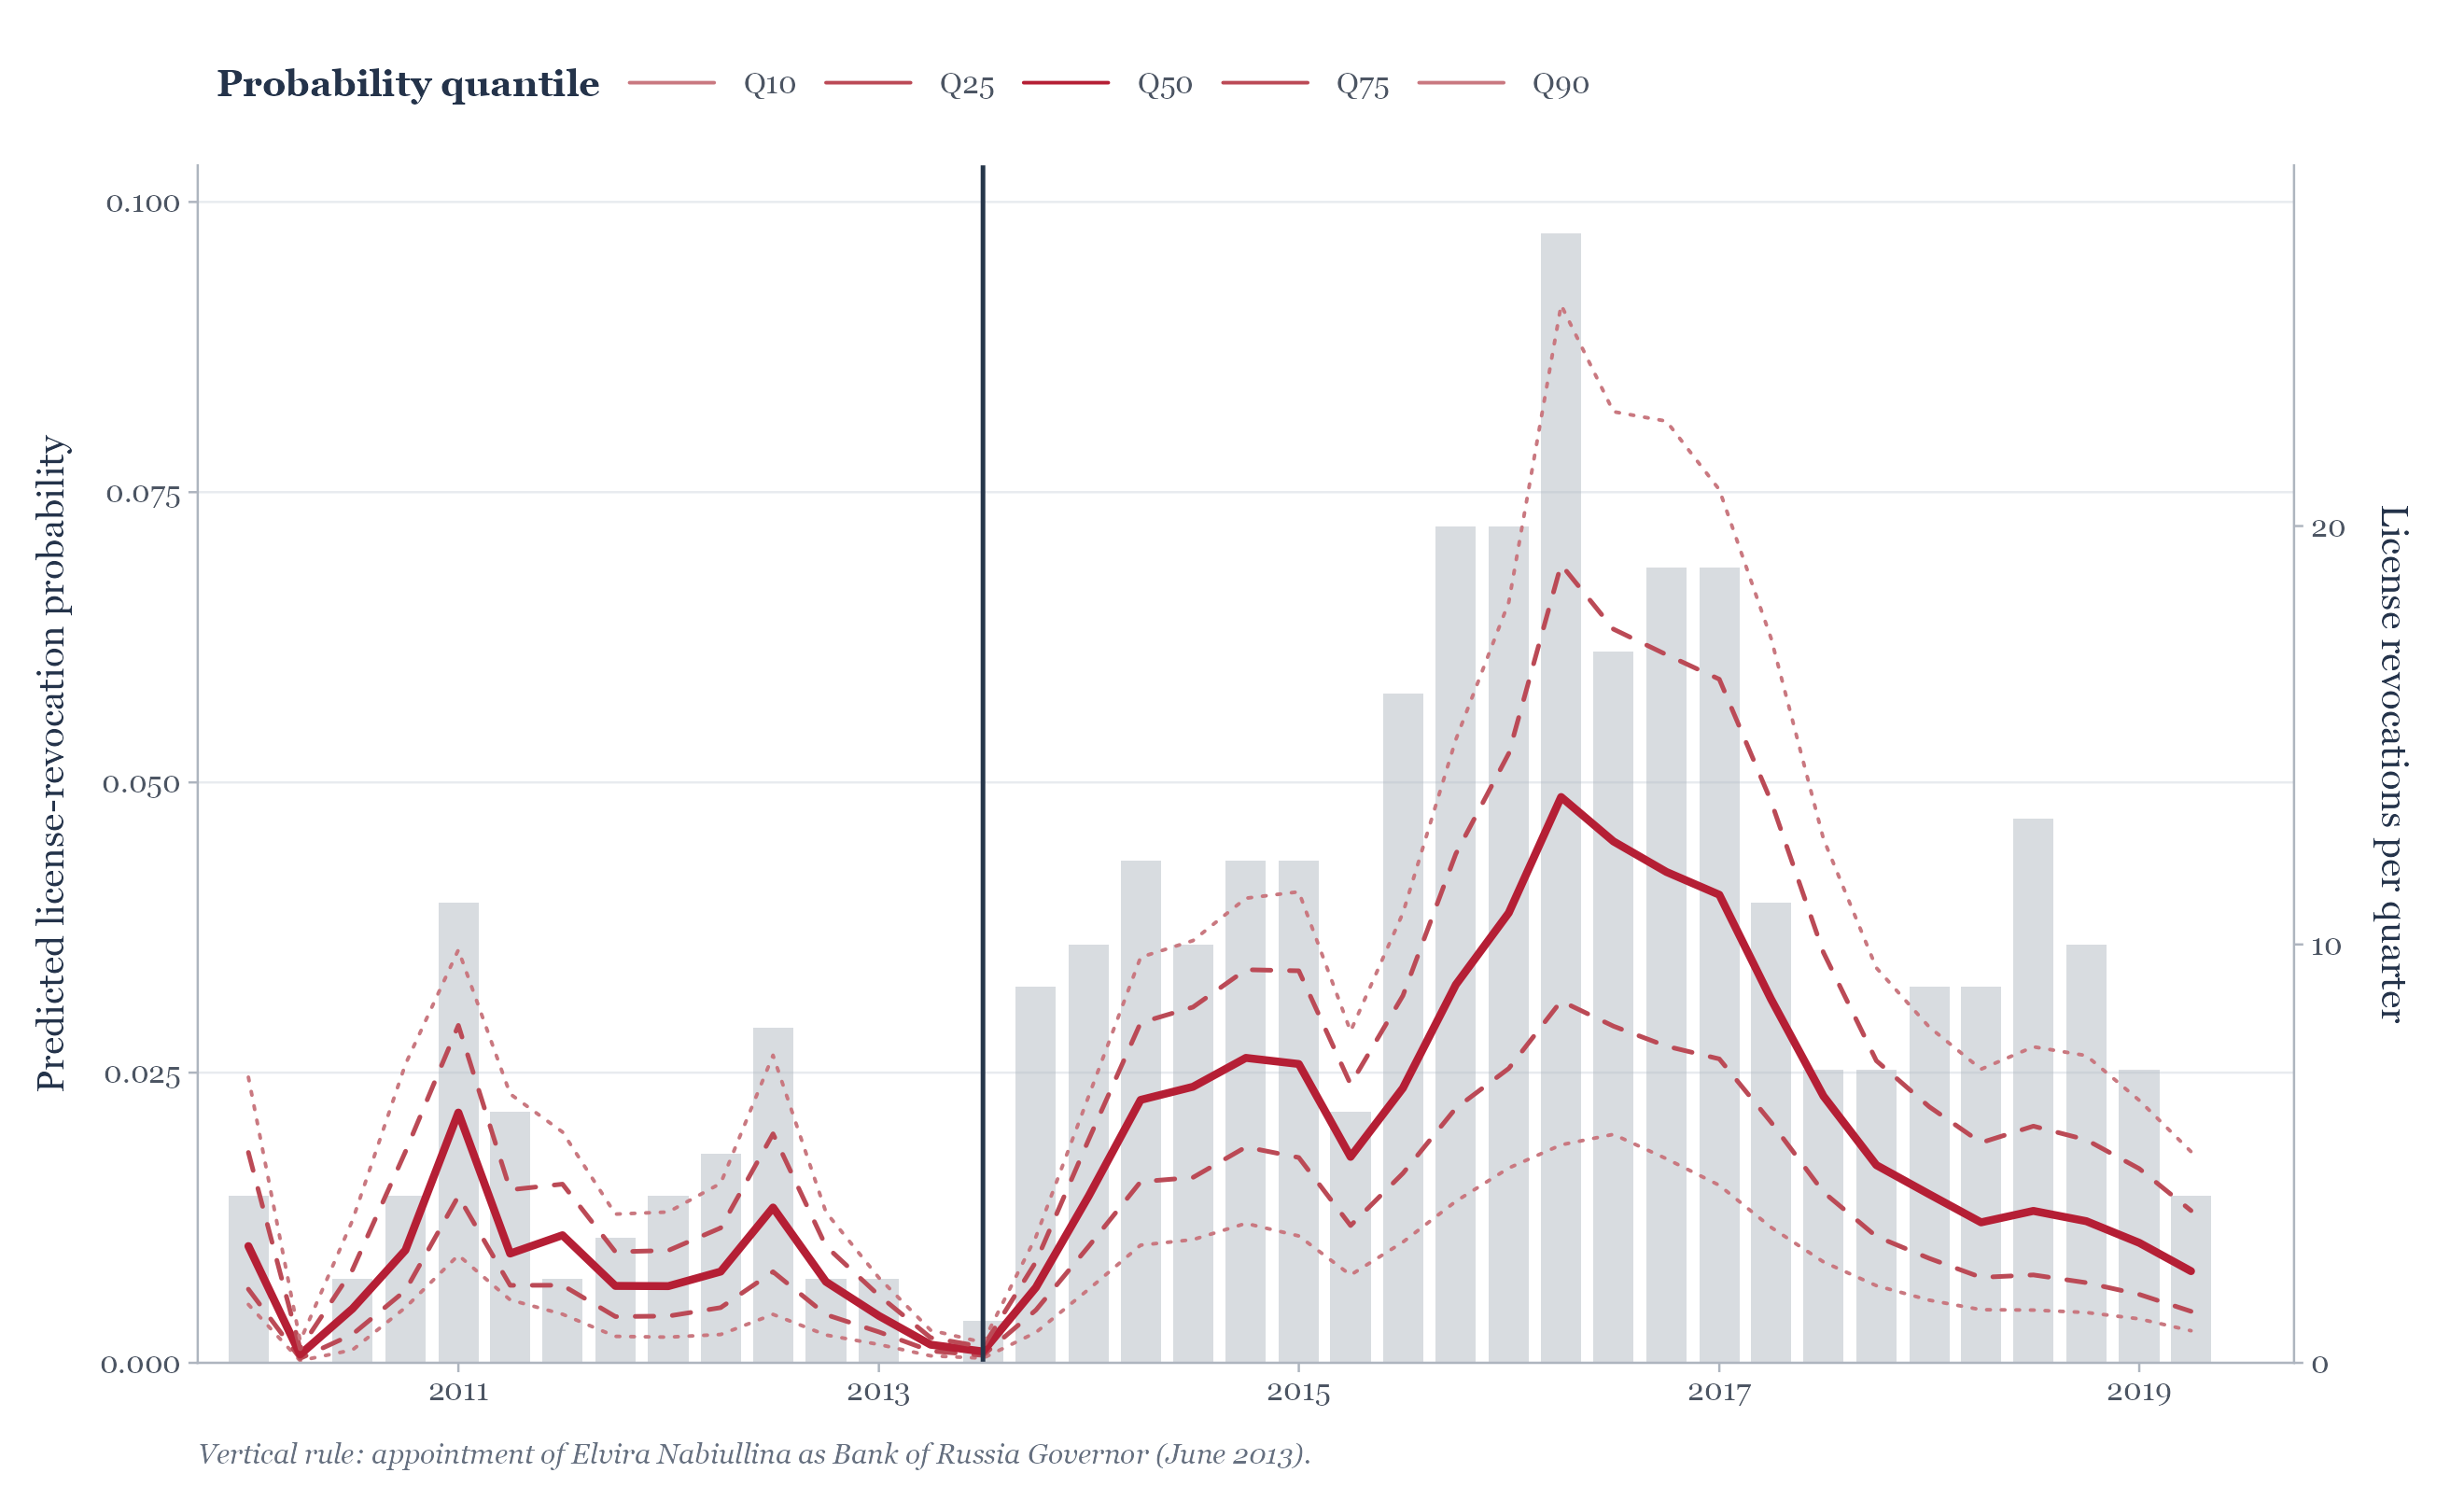
Figure 2. Quarterly distribution of predicted license-revocation probabilities among banks not revoked in the following quarter. Lines show the 10th, 25th, 50th, 75th, and 90th percentiles; gray bars show quarterly revocations. The vertical marker denotes Elvira Nabiullina’s appointment as Governor of the Bank of Russia in June 2013. Click the figure to open the vector PDF.
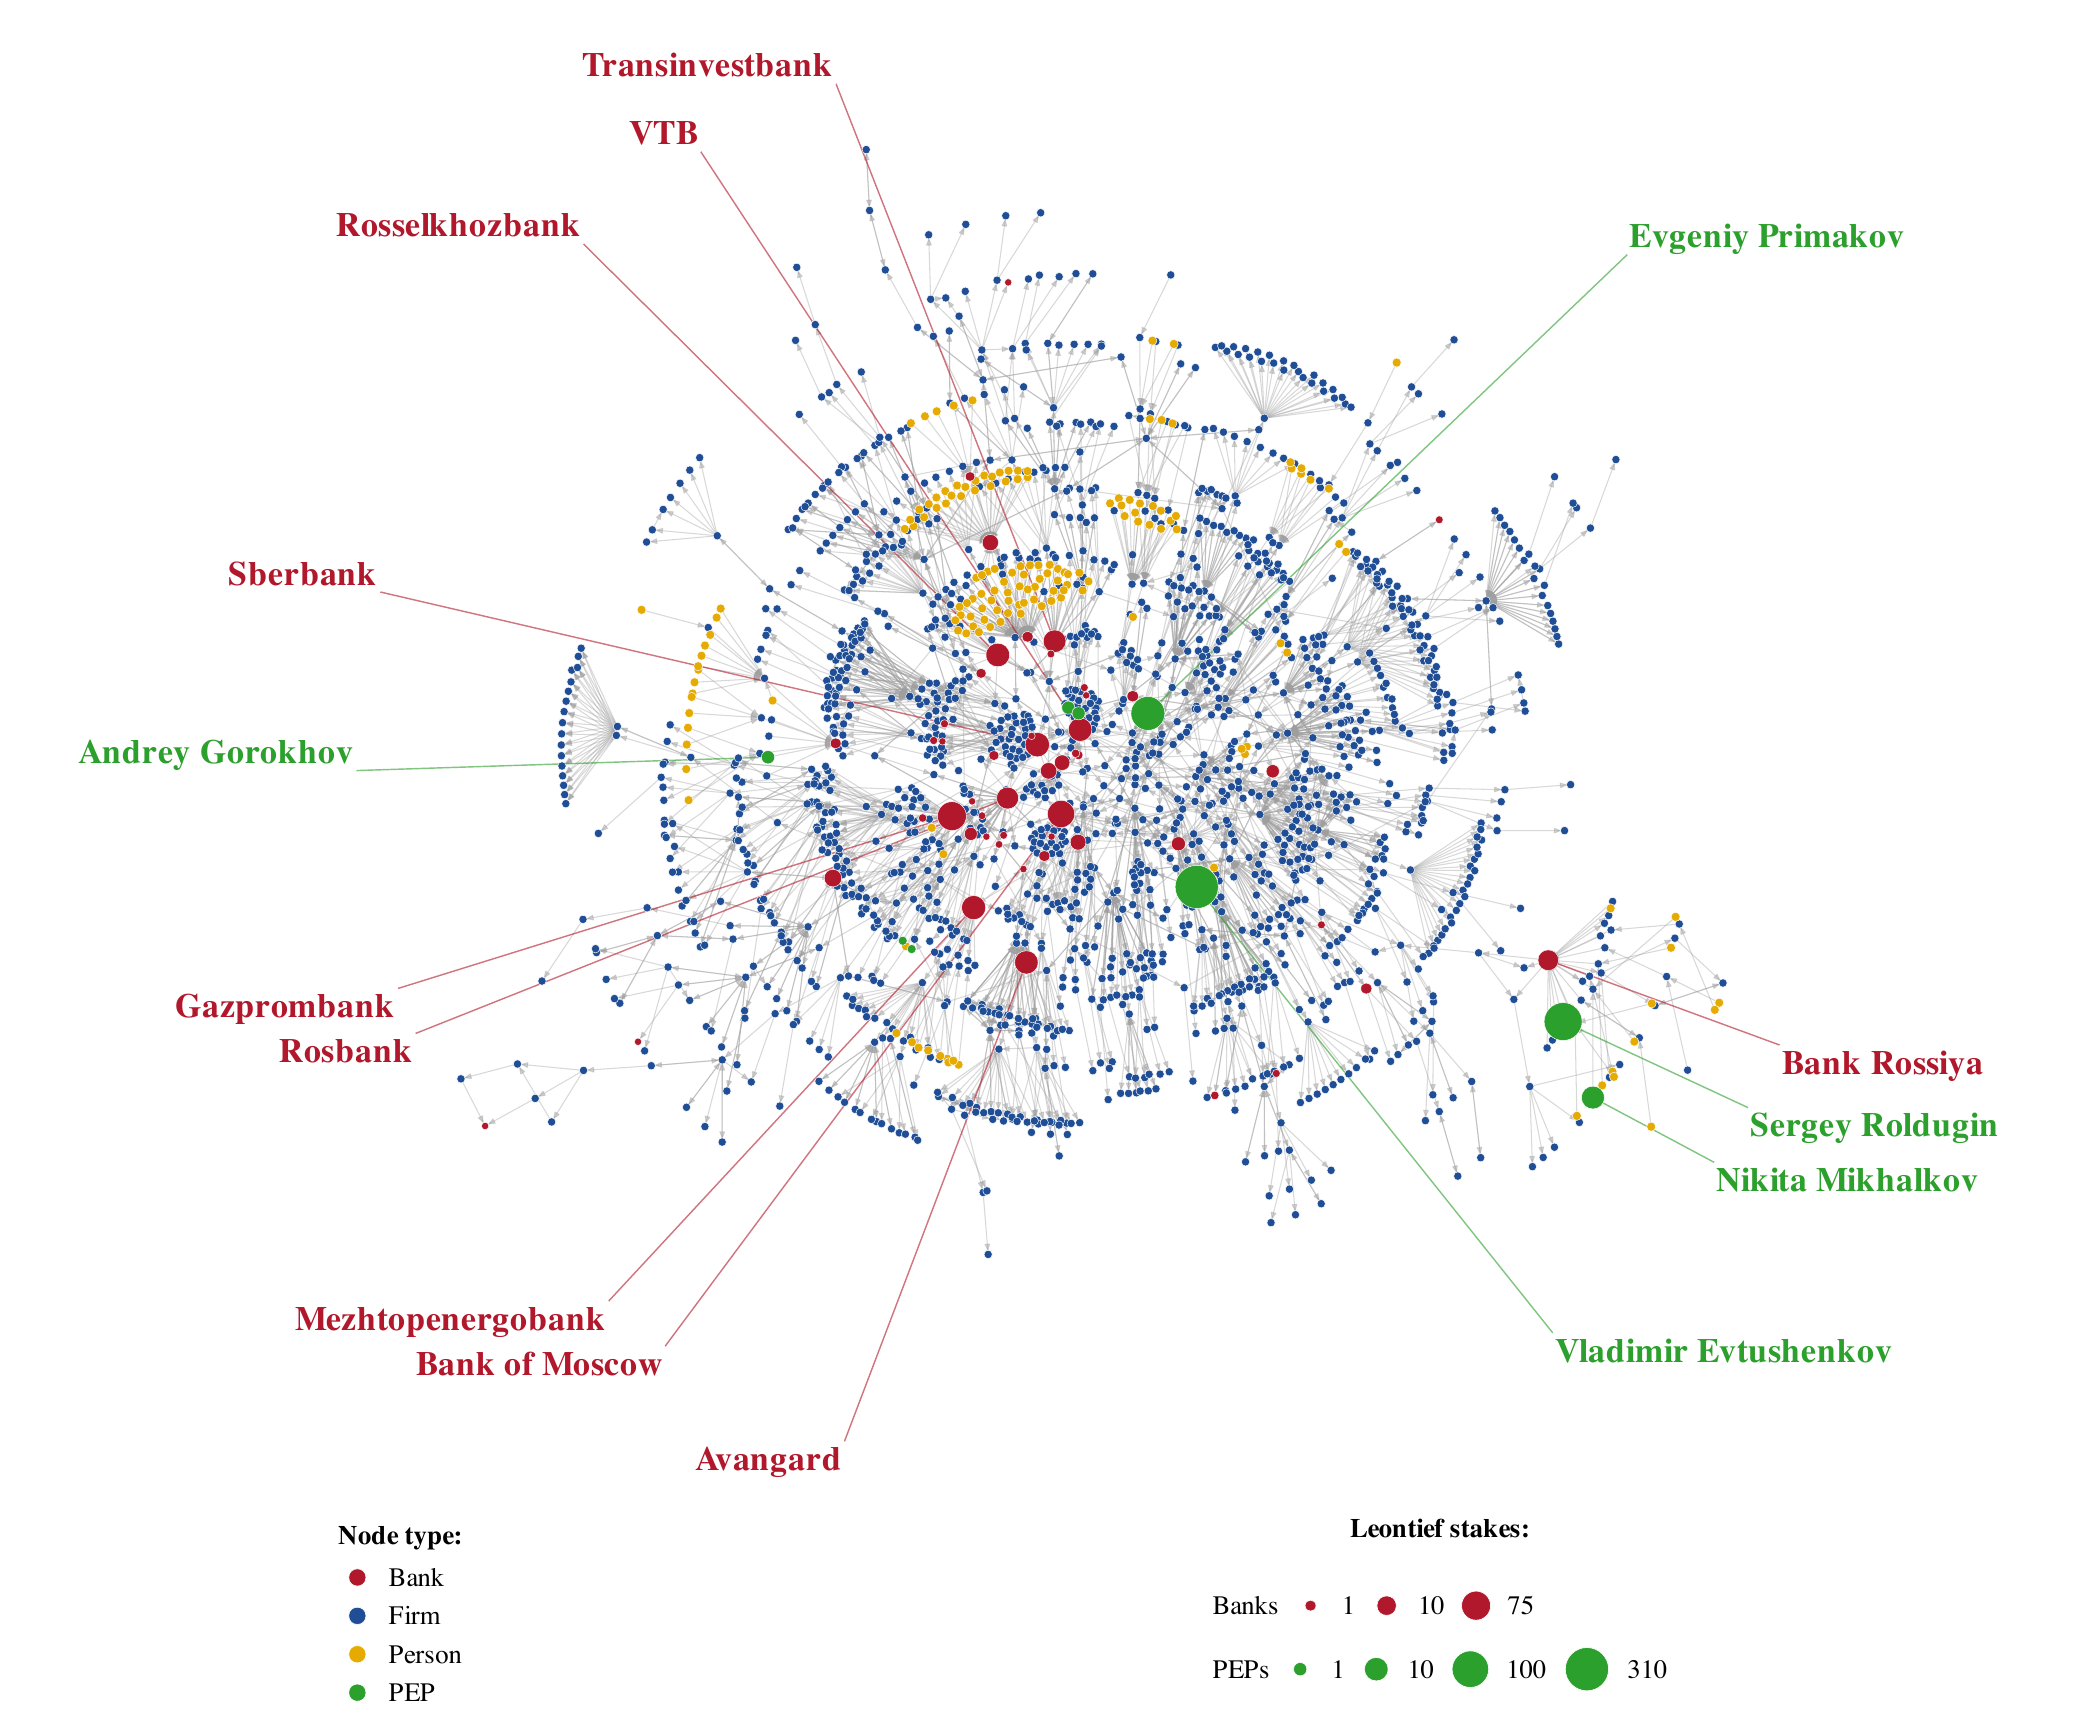
Figure 3. Full ownership ego networks of the ten banks with the largest downward Leontief stakes in 2013Q1, one quarter before Nabiullina’s appointment. Each network follows direct and indirect ownership chains to their ends. Red nodes are banks, blue nodes are firms, gold nodes are other individuals, and green nodes are politically exposed persons (PEPs); gray arrows point from owner to owned. Bank and PEP circle sizes are proportional to their Leontief stakes, on separate scales. Click the figure to open the vector PDF.
Electoral cycles, political alignment, and subsidy allocation: Evidence from Germany
PDF
› abstract
Abstract: We examine whether political alignment between county and state governments affects the allocation of Germany’s largest place-based investment subsidy program. We combine approximately 51,000 GRW projects from 2000 to 2019 with hand-collected election and coalition data. Our county and year fixed-effects design separates changes in alignment from state and county electoral cycles. Alignment increases approved subsidy volume by 176%, approximately 3 million Euro in the average county-year, and raises the number of approved projects by 31% of its mean. Aligned counties also request 58% more support and submit 1.34 additional projects, which indicates that the allocation difference begins at the application stage and widens during approval. GRW-supported investment rises by 217%, while county employment increases by 1.1%. The alignment gradient strengthens with the county party’s political power in the state government and varies across regions and program periods.
| Allocation | Real effects | ||||
|---|---|---|---|---|---|
| GRW subsidy (log) |
Savings-bank loans PC |
Cooperative-bank loans PC |
GRW investment (log) |
County employment (log) |
|
| Aligned County | 1.038***(0.198) | 0.881***(0.238) | 1.024***(0.232) | 1.181***(0.227) | 0.011***(0.003) |
| Aligned County × Public Loans PC |
0.446*(0.264) | 0.147(1.561) | |||
| N Obs. | 5,872 | 5,309 | 5,309 | 5,872 | 5,872 |
| N Counties | 315 | 300 | 300 | 315 | 315 |
| R2 Within Adj. | 0.035 | 0.034 | 0.033 | 0.033 | 0.450 |
| County FE | + | + | + | + | + |
| Year FE | + | + | + | + | + |
| Panel A: GRW Subsidy (log) | ||||
|---|---|---|---|---|
| Popular Vote Winner |
Coalition Member |
Finance Minister |
Coalition Winner |
|
| (1) | (2) | (3) | (4) | |
| Aligned County | 0.225(0.238) | 0.710***(0.197) | 0.957***(0.216) | 1.039***(0.198) |
| R2 Within Adj. | 0.028 | 0.031 | 0.033 | 0.035 |
| N Obs. | 5,873 | 5,873 | 5,847 | 5,873 |
| N Counties | 315 | 315 | 315 | 315 |
| County FE | + | + | + | + |
| Year FE | + | + | + | + |
Standard errors in parentheses. All specifications include county and year fixed effects and the paper's controls; control coefficients are omitted. Standard errors are clustered by county. *** p<0.01, ** p<0.05, * p<0.10. In the first table, savings- and cooperative-bank columns interact alignment with county-level loans per capita; they are not subsamples of firms linked to those bank types. Their smaller N reflects coverage of the lending measures. The Aligned County coefficient in those columns is conditional on Public Loans PC being zero. The second table reproduces Table 8, Panel A, columns 1–4 of the Kazakov–Koetter paper.
Work in Progress
Political Lending Along the 'Freedom Ladder'
Single authored
› abstract
Abstract: What politicians do to stay in power? Existing work shows that incumbents maximize their re-election chances through cycles of fiscal spending or lending by state banks. Yet either of the two instruments has been studied in isolation and exclusively in democratic setting, while recent evidence documents that more countries are drifting toward authoritarian rule. This paper aims to generalize existing evidence by tracing evolution of fiscal and lending cycles along a country’s path down the ‘freedom ladder’. I further test whether political use of state banks goes beyond previously documented rent extraction and tactical redistribution but also serves to maintain political control, by using credit to offset center–periphery frictions and to respond quickly to episodes of social unrest. The analysis also requires bringing protests, repression, and propaganda into the empirical framework, which has not been done yet due to severe scarcity of such data. I aim to fill this gap by drawing on an arguably most comprehensive hand-collected single-country dataset, providing insight into two decades of political life in Russia.
Healing Markets: Repression, Victimization and Market Reforms
› abstract
Abstract: This paper investigates whether the development of market institutions can mitigate the long-term economic "scars" left by historical political repressions. While a body of literature documents the persistence of historical effects in economic behavior, few studies explore the conditions under which these effects can be reversed. We hypothesize that marketization facilitates a critical transition from relational exchange—dependent on personal reputation and family background—to impersonal exchange governed by formal rules, credit scores, and transparent contracts. In doing so, market-oriented reforms may render the "victimization" of previous generations irrelevant to modern economic outcomes.
Utilizing a novel, high-resolution dataset, we measure municipality-level repression intensity using geocoded arrest addresses from the Stalinist era in Russia. We match this with a newly constructed, registry-based Marketization Index covering over 2,600 municipalities, which captures firm dynamism (entry-to-exit rates), financial access, privatization, and the efficiency of contract enforcement and insolvency proceedings. We then examine the impact of historical repression on contemporary personal default rates and debt burdens.
We aim to test whether regions with higher historical repression intensity exhibit higher rates of personal insolvency today, and crucially, whether the presence of robust market institutions attenuates this relationship. This study provides some of the first empirical evidence on the reversibility of historical scars, suggesting that competitive markets can "punish" the persistence of discrimination and victimization by prioritizing institutional merit over historical background.